
Enterprise Reporting
Through Sharperlight’s Bidirectional Writeback system, your data is securely shared between all your enterprise locations, updated and validated in real-time via the intuitive data entry and reporting interface.
- Excel® Addin with secure and direct access to data sources – refresh with current data
- Web channel displays tabular html and rendered charts using Kendo UI for beautiful graphical presentation with drilldown
- Refresh chart data in real time
- Enterprise wide access to sources
- Rapid report creation, publication and delivery
- Low maintenance
- No embedded SQL encourages central Datamodel
New in v8
Introducing Sharperlight 8: your datamodels, opened to your AI
Every AI vendor is racing to build a semantic layer. Sharperlight has run one in production for twenty years. Version 8 opens it two ways:
- An MCP server your assistant connects to for live, governed answers. (October 2026)
- A metadata export for organisations that can’t connect an AI to anything. (Available now)
Real, inspectable Sharperlight queries
Build and schedule reports from the conversation
Works fully air-gapped

New in v8
Introducing Sharperlight 8: your datamodels, opened to your AI
Every AI vendor is racing to build a semantic layer. Sharperlight has run one in production for twenty years. Version 8 opens it two ways:
- An MCP server your assistant connects to for live, governed answers.
- A metadata export for organisations that can’t connect an AI to anything.
Real, inspectable Sharperlight queries
Build and schedule reports from the conversation
Works fully air-gapped




Suite of Components Each core feature of Sharperlight is made up of a suite of individual components. They can be used independently to help you shape and refine your information to exactly how you want.
-
Web Reporting
Sharperlight can present dynamic tables, charts, pivot tables and presentation reports using its own web service. It has an application called Publisher, for managing and configuring these published queries. Each query can be filtered and refreshed in the web, and it will return the latest data.
- The web content delivered through Publisher can be graduated with basic HTML4 tables, more complex HTML4 with Javascript automation, all the way to sophisticated HTML5 visualisations.
- The core charting engine renders the graphics in HTML5.
- Every published query has a unique web address referencing the query and the output style. This means each query can be uniquely referenced in a webpage, or in an email, or bookmarked in a web browser.
- For pixel perfect report layouts, Publisher has a WYSIWYG report designer that can output reports to PDF, HTML and Microsoft Word.
-
Dashboarding
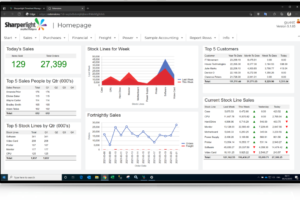
Dashboards are created and maintained using an HTML5 interface in a web browser. A dashboard consists of a page and each page can contain multiple rectangular tiles. The tiles can be resized and re-positioned, the tile can display published content from Publisher or display any valid web address.
- Tiles have a default content view and an expanded view that can be displayed by double clicking on the tile title bar.
- A single dashboard can mashup content from multiple data sources.
- Every dashboard has a unique URL address and thus, they can be embedded into any browser interface that supports a URL.
- Tiles can auto align to each other or overlap, each can have different colour scheme and tooltips can be added to the tile title bar.
-
Dashboarding
Dashboards are created and maintained using an HTML5 interface in a web browser. A dashboard consists of a page and each page can contain multiple rectangular tiles. The tiles can be resized and re-positioned, the tile can display published content from Publisher or display any valid web address.
- Tiles have a default content view and an expanded view that can be displayed by double clicking on the tile title bar.
- A single dashboard can mashup content from multiple data sources.
- Every dashboard has a unique URL address and thus, they can be embedded into any browser interface that supports a URL.
- Tiles can auto align to each other or overlap, each can have different colour scheme and tooltips can be added to the tile title bar.
-
Data Capture
Sharperlight has multiple methods of data capture. From within Microsoft Excel, the Sharperlight Add-in can validate and bulk load records using its template driven Writeback interface. The are also Writeback formulas where the Sharperlight formula can be over-written, the input value is interpreted and updated in the data source whilst the cell is reverted back to the formula. In the web Sharperlight can generate web entry forms and entry grids.
- All data updates are managed through the secure datamodel layer where rules and constraints are enforced.
- Extensive control on lookup and validation lists to ensure that incomplete or erroneous information is caught in the data entry and not during the data load.
- Data capture uses the Sharperlight Web Service to interface with the target data store and therefore, the data entry does not need a direct connection to the target system.
-
Query Builder
The Query Builder is a user interface with separate panes for filters, field selection and output. Simple enough for the infrequent user but it does have deep functionality with menus on each pane title and fields have right hand click menus. In the filter pane the user can select between different query styles using the mode filter and when the user selects the table, it becomes the focus for the query structure and it populates the fields and relationships in the selection pane.
- The datamodel acts as a presentation layer between the complexity of the data source and presents to the users a unified view of query tables, with available fields and relationships.
- The Query Builder uses drag and drop to select filters and outputs, most fields can be a filter and/or an output. The query engine will construct the query on the fly and optimise the syntax.
- The filters can inherit and display lookup lists from the datamodel and there are standard lookup wizards for dates and periods.
- Query results can be previewed in the Query Builder to assist in query design and Preview grid supports drill for further analysis.
-
Scheduler
The Scheduler is an automation interface for the execution of tasks on a recurring and ad-hoc basis. Each task can have many actions and a task can be executed manually or a schedule. To allow concurrent activity, the Scheduler is only available on installations that have five or more full licenses.
- Optionally and conditionally execute reports that can store, save and email content.
- Include expression based logic to drive multiple scenarios.
- Send notification and exception reporting.
- Create, collate and deliver Board Report packs.
-
Agile Datamarts
It is sometimes useful to have the ability to stage query data into a physical data set that can be summarised for performance or fixed to allow consistent reporting. Often referred to as Agile Datamarts, Sharperlight has a simple end-user interface called Materialised Query for designing and populating physical tables based on a query.
- The data can be refreshed at will or on a schedule, or it can be held indefinitely as an audit history.
- Materialised queries are presented to the end-user as just another datamodel and they can be queried using all the standard Sharperlight functionality and presentation tools.
-
Solution Development
Sharperlight is an application framework for interacting with complex operational databases and it controls all data interactions using an abstraction layer called a Datamodel. These models are developed and maintained using a Studio designer and at the lowest level they encapsulate data structures, relationships and business rules.
The data definition is only part of the story, datamodels have a rich command language and data access can be controlled and modified based on system, user and data events. Datamodels are also fully multi-lingual, just like the Sharperlight application, and a datamodel can combine .NET code and package WinForms and web content.
Whilst many Sharperlight customers utilise it for spreadsheet integration, self-service reporting, web reporting and dashboarding; it has a much bigger picture. Sharperlight has a secure gateway and a web service, a datamodelling concept that can unify information from numerous data sources and the tools to quickly develop datamodels and user content.
-
Security
Datamodel and application interfaces are secured on the server using Site Setup. User authentication is available as a native login, using Windows Authentication, Active Directory Groups and LDAP Groups. A datamodel can have its own data security layer which secures the visible query objects and enforces record level security.
-
Report Designer
The report designer provides more control on the positioning and layout of report pages, and it addresses many of the printing limitations inherit in web browser rendering. It uses a third party component library to provide the reporting engine and a graphical What You See Is What You Get (WYSIWG) designer interface.
- Uses the Query Builder to construct the data sets and it automatically integrates the query as a report data source.
- Allows pixel perfect control of field and object placement for reports and business documents.
- Reports can be accessed through the Sharperlight Web Service and run locally on computers that have the Sharperlight rich client.
- In the web the reports use the common filter bar to feed parameters back to the underlying reporting engine.
- The reports can be rendered into PDF and native HTML, it also supports output to Microsoft Excel and Word.
-
Message Queue (MQTT)
Often there are benefits using lightweight messaging and thus, the MQTT messaging protocol has been added to the Sharperlight libraries. MQTT is an ISO standard publish-subscribe model where the publisher sends messages to a broker (server) and the broker then distributes the information to any clients that have subscribed to the topic. Another way to describe MQTT, is that it can collect data from many devices and then transport the information to other control systems.
- With MQTT, Sharperlight means it can act as both a client and server.
- Scheduler has an action to host the MQTT Server (broker). The server can be bound to a Service Code and authenticated using the user accounts in Site Setup or specified user details.
- There is an equivalent MQTT Server query table in System datamodel, it can be used by the Query Builder to return the last retained data values for each topic.
- The JavaScript libraries have been extended to include functions to connect, publish and subscribe to MQTT.
- There are new expression functions to send messages.
- Web Reporting
- Dashboarding
- Excel Reporting
- Data Capture
- Query Builder
- Scheduler
- Agile Datamarts
- Solution Development
- Security
- Report Designer
- Message Queue
Web Reporting
Sharperlight can present dynamic tables, charts, pivot tables and presentation reports using its own web service. It has an application called Publisher, for managing and configuring these published queries. Each query can be filtered and refreshed in the web, and it will return the latest data.
- The web content delivered through Publisher can be graduated with basic HTML4 tables, more complex HTML4 with Javascript automation, all the way to sophisticated HTML5 visualisations.
- The core charting engine renders the graphics in HTML5.
- Every published query has a unique web address referencing the query and the output style. This means each query can be uniquely referenced in a webpage, or in an email, or bookmarked in a web browser.
- For pixel perfect report layouts, Publisher has a WYSIWYG report designer that can output reports to PDF, HTML and Microsoft Word.
Dashboarding
Dashboards are created and maintained using an HTML5 interface in a web browser. A dashboard consists of a page and each page can contain multiple rectangular tiles. The tiles can be resized and re-positioned, the tile can display published content from Publisher or display any valid web address.
- Tiles have a default content view and an expanded view that can be displayed by double clicking on the tile title bar.
- A single dashboard can mashup content from multiple data sources.
- Every dashboard has a unique URL address and thus, they can be embedded into any browser interface that supports a URL.
- Tiles can auto align to each other or overlap, each can have different colour scheme and tooltips can be added to the tile title bar.
Excel Reporting
The Sharperlight Excel® Add-in gives end-users easy access to the Query Builder and a drilldown data explorer. The Sharperlight queries are ancored in the worksheets, using formulas and the construction of these formulas is wizard driven through the Query Builder. These formulas fully support cell referencing and automatic recalculation, so results will refresh as filters are changed or when a recalculation is forced.
- The Microsoft Excel Add-in is compatible with Excel versions from Office 2007 to 2021 and also local install of Office 365.
- Cell, Table and Sheet formulas.
- Filter with cell referencing and automatic lookup windows appear when double clicking referenced cells.
- Query Manager for managing and re-using seed queries in the same workbook.
- The Sharperlight formulas are drilldown points which can loaded into Explorer for slice and dice analysis.
Data Capture
Sharperlight has multiple methods of data capture. From within Microsoft Excel, the Sharperlight Add-in can validate and bulk load records using its template driven Writeback interface. The are also Writeback formulas where the Sharperlight formula can be over-written, the input value is interpreted and updated in the data source whilst the cell is reverted back to the formula. In the web Sharperlight can generate web entry forms and entry grids.
- All data updates are managed through the secure datamodel layer where rules and constraints are enforced.
- Extensive control on lookup and validation lists to ensure that incomplete or erroneous information is caught in the data entry and not during the data load.
- Data capture uses the Sharperlight Web Service to interface with the target data store and therefore, the data entry does not need a direct connection to the target system.
Query Builder
The Query Builder is a user interface with separate panes for filters, field selection and output. Simple enough for the infrequent user but it does have deep functionality with menus on each pane title and fields have right hand click menus. In the filter pane the user can select between different query styles using the mode filter and when the user selects the table, it becomes the focus for the query structure and it populates the fields and relationships in the selection pane.
- The datamodel acts as a presentation layer between the complexity of the data source and presents to the users a unified view of query tables, with available fields and relationships.
- The Query Builder uses drag and drop to select filters and outputs, most fields can be a filter and/or an output. The query engine will construct the query on the fly and optimise the syntax.
- The filters can inherit and display lookup lists from the datamodel and there are standard lookup wizards for dates and periods.
- Query results can be previewed in the Query Builder to assist in query design and Preview grid supports drill for further analysis.
Scheduler
The Scheduler is an automation interface for the execution of tasks on a recurring and ad-hoc basis. Each task can have many actions and a task can be executed manually or a schedule. To allow concurrent activity, the Scheduler is only available on installations that have five or more full licenses.
- Optionally and conditionally execute reports that can store, save and email content.
- Include expression based logic to drive multiple scenarios.
- Send notification and exception reporting.
- Create, collate and deliver Board Report packs.
Agile Datamarts
It is sometimes useful to have the ability to stage query data into a physical data set that can be summarised for performance or fixed to allow consistent reporting. Often referred to as Agile Datamarts, Sharperlight has a simple end-user interface called Materialised Query for designing and populating physical tables based on a query.
- The data can be refreshed at will or on a schedule, or it can be held indefinitely as an audit history.
- Materialised queries are presented to the end-user as just another datamodel and they can be queried using all the standard Sharperlight functionality and presentation tools.
Solution Development
Sharperlight is an application framework for interacting with complex operational databases and it controls all data interactions using an abstraction layer called a Datamodel. These models are developed and maintained using a Studio designer and at the lowest level they encapsulate data structures, relationships and business rules.
The data definition is only part of the story, datamodels have a rich command language and data access can be controlled and modified based on system, user and data events. Datamodels are also fully multi-lingual, just like the Sharperlight application, and a datamodel can combine .NET code and package WinForms and web content.
Whilst many Sharperlight customers utilise it for spreadsheet integration, self-service reporting, web reporting and dashboarding; it has a much bigger picture. Sharperlight has a secure gateway and a web service, a datamodelling concept that can unify information from numerous data sources and the tools to quickly develop datamodels and user content.
Security
Datamodel and application interfaces are secured on the server using Site Setup. User authentication is available as a native login, using Windows Authentication, Active Directory Groups and LDAP Groups. A datamodel can have its own data security layer which secures the visible query objects and enforces record level security.
Report Designer
The report designer provides more control on the positioning and layout of report pages, and it addresses many of the printing limitations inherit in web browser rendering. It uses a third party component library to provide the reporting engine and a graphical What You See Is What You Get (WYSIWG) designer interface.
- Uses the Query Builder to construct the data sets and it automatically integrates the query as a report data source.
- Allows pixel perfect control of field and object placement for reports and business documents.
- Reports can be accessed through the Sharperlight Web Service and run locally on computers that have the Sharperlight rich client.
- In the web the reports use the common filter bar to feed parameters back to the underlying reporting engine.
- The reports can be rendered into PDF and native HTML, it also supports output to Microsoft Excel and Word.
Often there are benefits using lightweight messaging and thus, the MQTT messaging protocol has been added to the Sharperlight libraries. MQTT is an ISO standard publish-subscribe model where the publisher sends messages to a broker (server) and the broker then distributes the information to any clients that have subscribed to the topic. Another way to describe MQTT, is that it can collect data from many devices and then transport the information to other control systems.
- With MQTT, Sharperlight means it can act as both a client and server.
- Scheduler has an action to host the MQTT Server (broker). The server can be bound to a Service Code and authenticated using the user accounts in Site Setup or specified user details.
- There is an equivalent MQTT Server query table in System datamodel, it can be used by the Query Builder to return the last retained data values for each topic.
- The JavaScript libraries have been extended to include functions to connect, publish and subscribe to MQTT.
- There are new expression functions to send messages.
Ready to modernise reporting for Version 8?
Tell us about your systems, reporting challenges, and what you want to improve. We’ll help you identify the best route for live reporting, dashboards, automation, AI assistance, or partner-led solutions.