
Displaying Totals in a Column Chart
Introduction
This post demonstrates how to include both individual values and the total amount in a column chart.
Practices
Prepare a query which returns a dataset for a column chart.
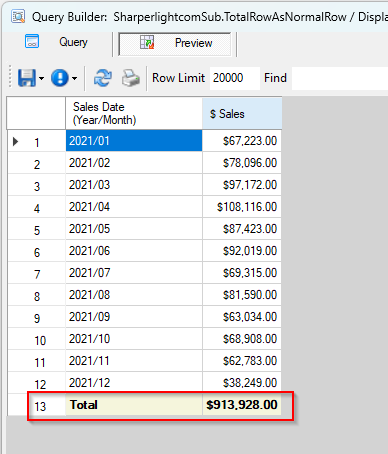
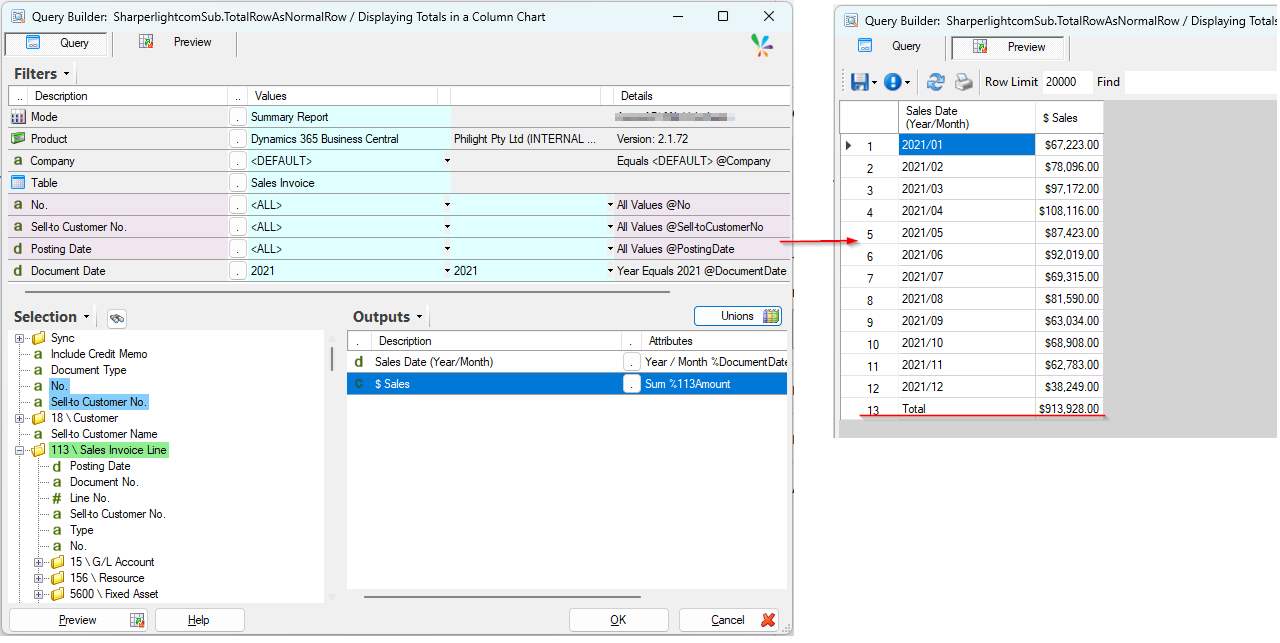
I prepared this dataset. The total is calculated automatically.
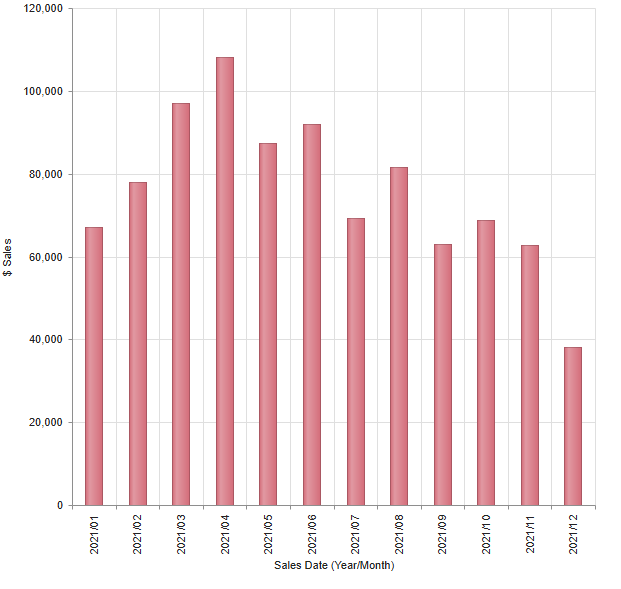
By default, the total value is not displayed on the individual bars when the dataset is visualized as a column chart.
Let’s look at the logic behind this solution.
While there are several ways to achieve this, we will use a query UNION for this example.
Adding a query UNION starts from here.
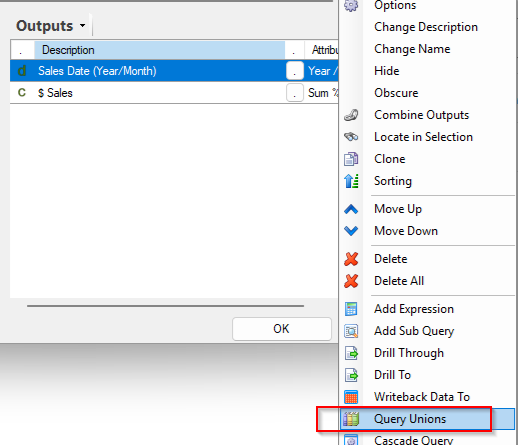
Add a UNION query by clicking ‘New‘ icon, configure the options and edit the query.
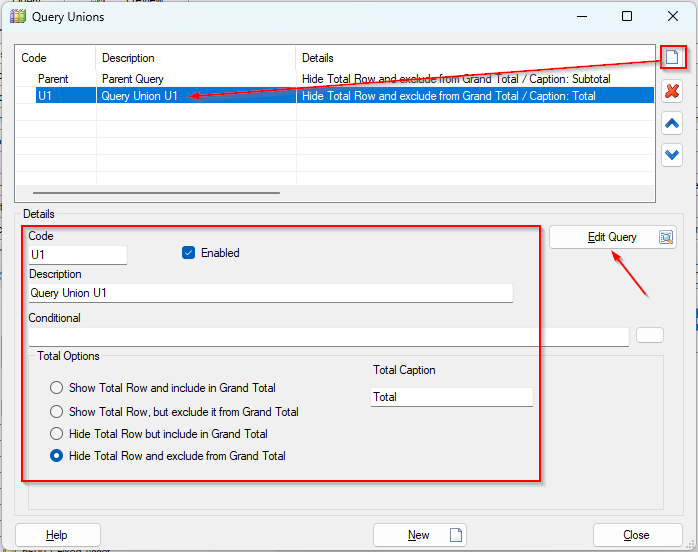
To maintain data consistency, the query UNION must mirror the parent’s results. This is achieved by using reference tags to pass filter values from the parent to the query UNION.
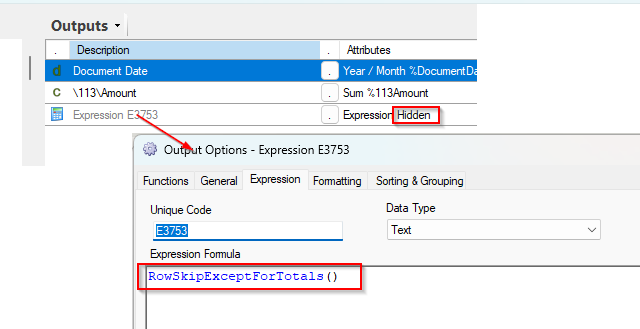
Next, we design the outputs. They must return the same dataset as the parent query, but we returns only the Total value.
This can be done with the expression formula “RowSkipExceptForTotals( )” which returns just the total row.
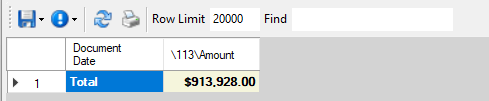
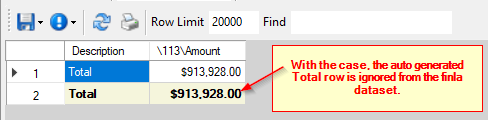
It returns this dataset.
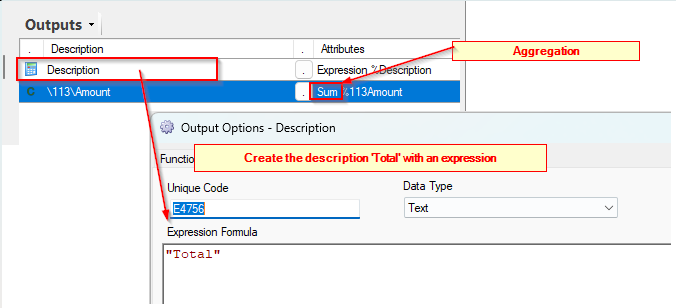
Otherwise, you can simply aggregate the amount. However, since this is a UNION query, you must ensure that the number of columns, their order, and their data types match the parent query exactly.
It also returns this dataset.
Now that the UNION query for the total value is prepared, let’s take a look at the final result. The total value is included in the final dataset
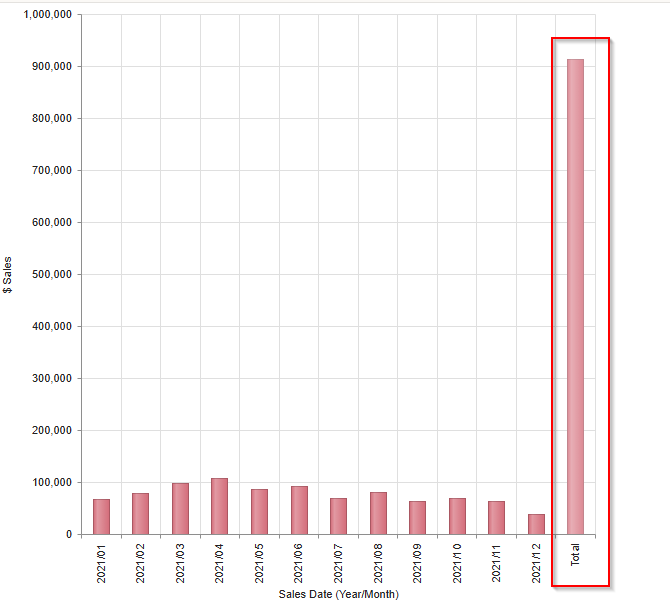
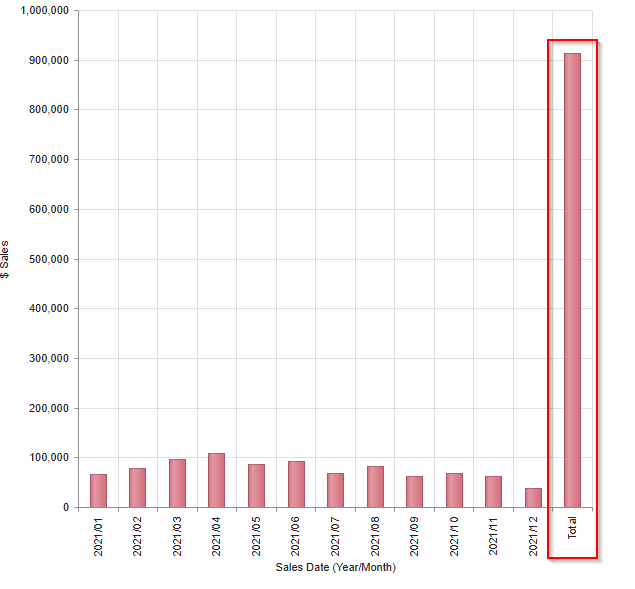
As a result, the column chart now includes the total as its own distinct bar, as shown here:
Afterword
We hope you enjoy using the Sharperlight Query Builder to tailor your datasets to your exact requirements.