
KENDO PivotGrid control
Introduction
The KENDO JavaScript library is bundled with Sharperlight and provides a variety of web UI controls that can be combined with Sharperlight published reports to create various web interfaces. In this post, I will focus on using the kendoPivotGrid / kendoPivotConfigurator controls.
Additionally, the jQuery library is also bundled with Sharperlight.
There are three things to prepare:
- The HTML code (including JavaScript) in which the kendoPivotGrid / kendoPivotConfigurator controls are defined.
- A published report that acts as a container for the HTML code.
- A published report that provides a dataset to the kendoPivotGrid control.
Practices
HTML code (including JavaScript code)
Header
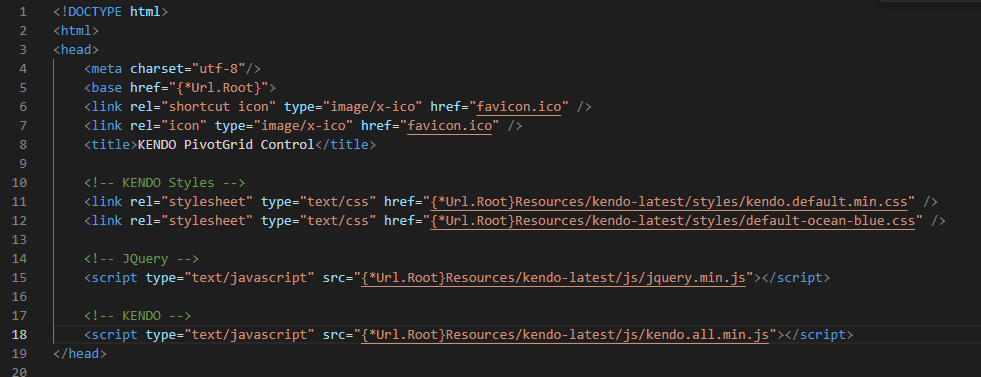
The reference to the Kendo JavaScript library and CSS styles are defined in the header section of the HTML code.
The specific Sharperlight tag “{*Url.Root}” is used and is replaced with the actual Sharperlight service URL at runtime.
Body
This is where KENDO PivotGrid / KENDO Pivot Configurator controls are created.

JavaScript
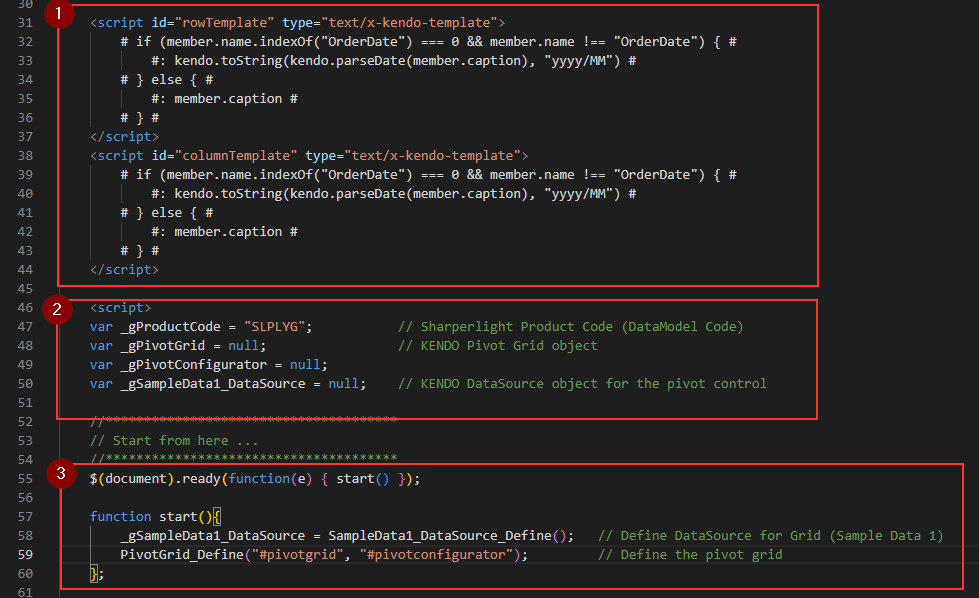
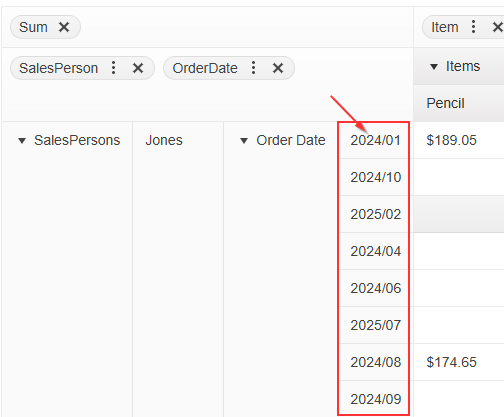
KENDO templates are defined here (1), and they format the date value when it is displayed in the columns and rows.
The global variables are defined at (2), and the code for what it should do when the page is loaded is defined here (3).
When the page is loaded,
1) The dataSource object is defined first.
As you can see, a published report is used as the datasource endpoint.

//**************************************
    // DataSource Constructions
    //**************************************
    function SampleData1_DataSource_Define(){
        let xUrl = "{_rootURL}DataSource/?query=" + _gProductCode + "_DAT.SampleData1"
                    + "&usid={_System.Rest.Usid}"	//{_System.Rest.Usid}"
                    + "&dfmt=jsonarray&dcat=UseNames";

        let xDs = {
            transport: {
                read: {
                    async: false,
                    cache: false,	// This is important to make request every time
                    datatype: "jsonp",
                    url: xUrl
                }
            },
            schema: {
                model: {
                    fields: {
                        Code:       { type: "string"    },
                        OrderDate:  { type: "date"      },
                        Region:     { type: "string"    },
                        SalesPerson:{ type: "string"    },
                        Item:       { type: "string"    },
                        Units:      { type: "string"    },
                        UnitCost:   { type: "number"    },
                        Total:      { type: "number"    },
                    }
                },
                cube: {
                    dimensions: {
                        Region:     { caption: "Regions" },
                        SalesPerson:{ caption: "SalesPersons" },
                        Item:       { caption: "Items" },
                        OrderDate:  { caption: "Order Date" }
                    },
                    measures: {
                        "Sum": { field: "Total", format: "{0:c}", aggregate: "sum" },
                        "Average": { field: "Total", format: "{0:c}", aggregate: "average" }
                    }
                }
            },
            columns: [
                { name: "Item" , expand: true}
            ],
            rows: [
                { name: "SalesPerson", expand: true }
            ],
            measures: ["Sum"]
        };

        return xDs;
    };
2) The KENDO PivotGrid / KENDO PivotConfigurator controls are configured.
function PivotGrid_Define(anchor, configurator){
        _gPivotGrid = $(anchor).kendoPivotGrid({
            rowHeaderTemplate: $("#rowTemplate").html(),
            columnHeaderTemplate: $("#columnTemplate").html(),
            filterable: true,
            sortable: true,
            columnWidth: 200,
            height: 1000,
            dataSource: _gSampleData1_DataSource
        }).data("kendoPivotGrid");

        $(configurator).kendoPivotConfigurator({
            dataSource: _gPivotGrid.dataSource,
            filterable: true,
            sortable: true,
            height: 1000
        });

    };
Importing the HTML as a resource
Create a published report that works as a container for the custom HTML.
Go to the Options tab, open the Resources editor, and then add the custom HTML by specifying its file path.
See ‘Resources in a Published Report‘ for more details.
Published Report for DataSource
A published report is required to feed data to the KENDO DataSource.
They are for the PivotGrid control.
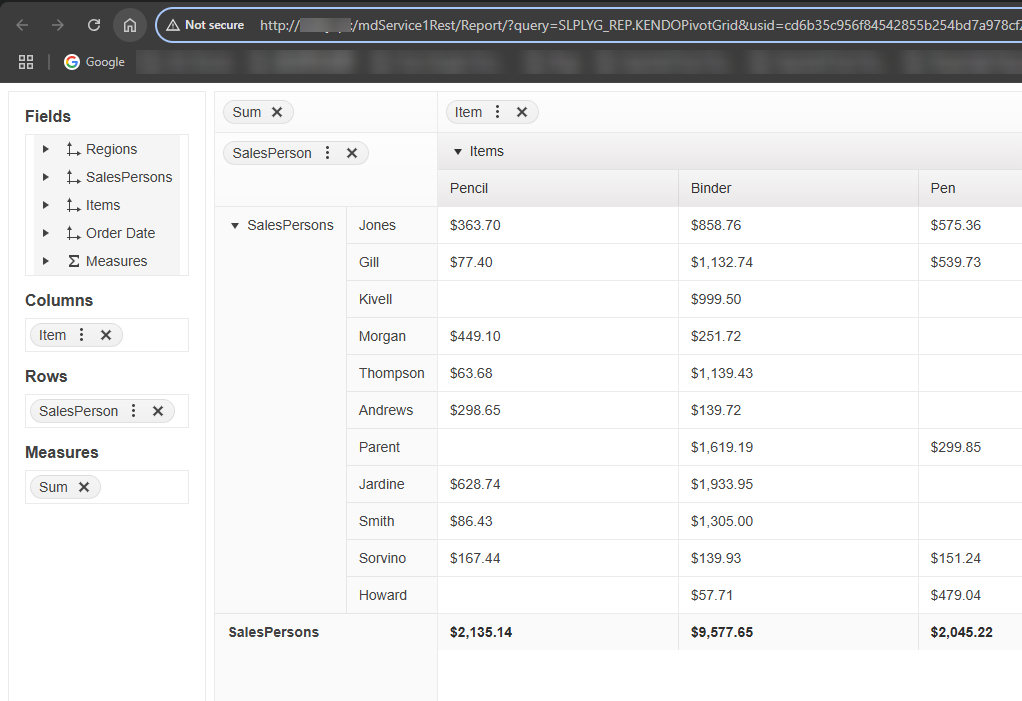
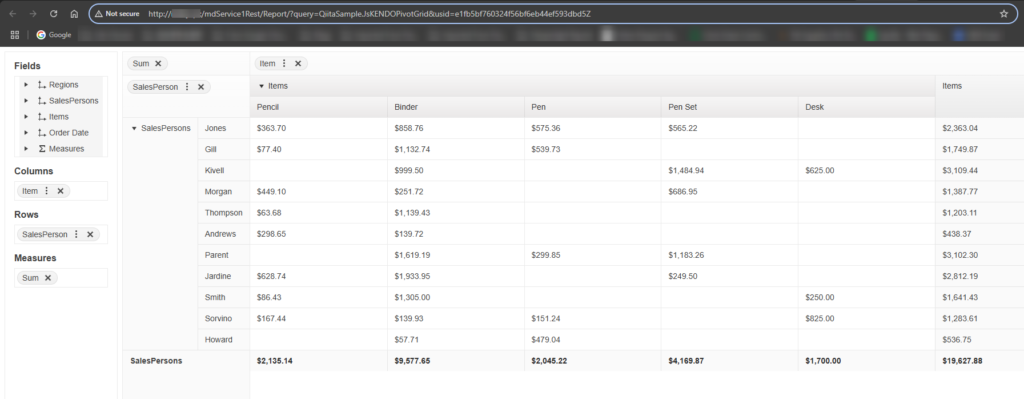
Once all the requirements are in place, it will look like this when opened in a browser.
Afterword
The extensibility of Sharperlight allows for the creation of comprehensive web applications. The data access layer can be designed using the query builder, eliminating the need to write SQL statements and making maintenance easier. This also enables developers to focus on UI design. In any case, try combining Sharperlight published reports (queries) with KENDO UI controls to create a variety of interactive reports.
Full Code (No error trap has not been written)
<!DOCTYPE html>
<html>
<head>
    <meta charset="utf-8"/>
	<base href="{*Url.Root}">
	<link rel="shortcut icon" type="image/x-ico" href="favicon.ico" />
    <link rel="icon" type="image/x-ico" href="favicon.ico" />
    <title>KENDO PivotGrid Control</title>

	<!-- KENDO Styles -->
    <link rel="stylesheet" type="text/css" href="{*Url.Root}Resources/kendo-latest/styles/kendo.default.min.css" />
    <link rel="stylesheet" type="text/css" href="{*Url.Root}Resources/kendo-latest/styles/default-ocean-blue.css" />

    <!-- JQuery -->
    <script type="text/javascript" src="{*Url.Root}Resources/kendo-latest/js/jquery.min.js"></script>

    <!-- KENDO -->
    <script type="text/javascript" src="{*Url.Root}Resources/kendo-latest/js/kendo.all.min.js"></script>
</head>

<body style="font-family: arial;">

    <style>
    </style>

    <div class="k-pivotgrid-wrapper">
	    <div id="pivotconfigurator"></div>
        <div id="pivotgrid"></div>
    </div>

    <script id="rowTemplate" type="text/x-kendo-template">
        # if (member.name.indexOf("OrderDate") === 0 && member.name !== "OrderDate") { #
            #: kendo.toString(kendo.parseDate(member.caption), "yyyy/MM") #
        # } else { #
            #: member.caption #
        # } #
    </script>
    <script id="columnTemplate" type="text/x-kendo-template">
        # if (member.name.indexOf("OrderDate") === 0 && member.name !== "OrderDate") { #
            #: kendo.toString(kendo.parseDate(member.caption), "yyyy/MM") #
        # } else { #
            #: member.caption #
        # } #
    </script>

    <script>
    var _gProductCode = "SLPLYG";           // Sharperlight Product Code (DataModel Code)
    var _gPivotGrid = null;                 // KENDO Pivot Grid object
    var _gPivotConfigurator = null;
    var _gSampleData1_DataSource = null;    // KENDO DataSource object for the pivot control

    //**************************************
    // Start from here ...
    //**************************************
    $(document).ready(function(e) { start() });

    function start(){
        _gSampleData1_DataSource = SampleData1_DataSource_Define();   // Define DataSource for Grid (Sample Data 1)
        PivotGrid_Define("#pivotgrid", "#pivotconfigurator");         // Define the pivot grid
    };

    function PivotGrid_Define(anchor, configurator){
        _gPivotGrid = $(anchor).kendoPivotGrid({
            rowHeaderTemplate: $("#rowTemplate").html(),
            columnHeaderTemplate: $("#columnTemplate").html(),
            filterable: true,
            sortable: true,
            columnWidth: 200,
            height: 1000,
            dataSource: _gSampleData1_DataSource
        }).data("kendoPivotGrid");

        $(configurator).kendoPivotConfigurator({
            dataSource: _gPivotGrid.dataSource,
            filterable: true,
            sortable: true,
            height: 1000
        });

    };

    //**************************************
    // DataSource Constructions
    //**************************************
    function SampleData1_DataSource_Define(){
        let xUrl = "{_rootURL}DataSource/?query=" + _gProductCode + "_DAT.SampleData1"
                    + "&usid={_System.Rest.Usid}"	//{_System.Rest.Usid}"
                    + "&dfmt=jsonarray&dcat=UseNames";

        let xDs = {
            transport: {
                read: {
                    async: false,
                    cache: false,	// This is important to make request every time
                    datatype: "jsonp",
                    url: xUrl
                }
            },
            schema: {
                model: {
                    fields: {
                        Code:       { type: "string"    },
                        OrderDate:  { type: "date"      },
                        Region:     { type: "string"    },
                        SalesPerson:{ type: "string"    },
                        Item:       { type: "string"    },
                        Units:      { type: "string"    },
                        UnitCost:   { type: "number"    },
                        Total:      { type: "number"    },
                    }
                },
                cube: {
                    dimensions: {
                        Region:     { caption: "Regions" },
                        SalesPerson:{ caption: "SalesPersons" },
                        Item:       { caption: "Items" },
                        OrderDate:  { caption: "Order Date" }
                    },
                    measures: {
                        "Sum": { field: "Total", format: "{0:c}", aggregate: "sum" },
                        "Average": { field: "Total", format: "{0:c}", aggregate: "average" }
                    }
                }
            },
            columns: [
                { name: "Item" , expand: true}
            ],
            rows: [
                { name: "SalesPerson", expand: true }
            ],
            measures: ["Sum"]
        };

        return xDs;
    };

    </script>
</body>
</html>