
Publisher Chart Types and Options
Publisher can display Charts in the Web Channel in a number of ways and depending on the method choosen there will be a different selection of Chart Types. Generally the Publisher Chart tab is used for most charting as it’s the easiest to use and setup and also supports any Drill Throughs that may have been defined on the Query Builder.
Most of these methods support a common core of Chart Types with some unique Chart Types of their own.
- Publisher Chart
- These Charts are build into Publisher and will auto adjust most query data so it can be charted.
- Supports Drill Through
- http://www.philight.com.au/Lists/Posts/Post.aspx?ID=77
- Publisher Page
- Has a good selection of Chart Types and also Sparklines
- Manual Drill Through can be acheived by binding URLs to the Action property
- http://our.componentone.com/wp-content/uploads/2009/05/AR6Designer.pdf
- Has a good selection of Chart Types and also Sparklines
- Publisher Excel
- Any Chart contained in a Excel Worksheets can be Published to the Web Channel
- No Drill Through on the Chart Elements is possible but Drill Through on the whole report is possible
- http://www.philight.com.au/Lists/Posts/Post.aspx?ID=34
- http://www.philight.com.au/Lists/Posts/Post.aspx?ID=36
- Any Chart contained in a Excel Worksheets can be Published to the Web Channel
- Publisher Query Expressions using Html and Images
- Expression can call out the online visualization library such as Google Charts
- Sharperlight also has a basic library of sparklines etc that are pre-rendered as images
- https://www.youtube.com/watch?v=FM7Frmk-oCw
- Expression can call out the online visualization library such as Google Charts
- Publisher Custom HTML and JavaScript
- Sharperlight using the Kendo UI for most of the HTML charts. Custom HTML can be used to build your own Chart with the Sharperlight Data.
- http://www.philight.com.au/Lists/Posts/Post.aspx?ID=103
- http://demos.telerik.com/kendo-ui/bar-charts/multiple-axes
- Sharperlight using the Kendo UI for most of the HTML charts. Custom HTML can be used to build your own Chart with the Sharperlight Data.
Publisher – Page List 
Publisher – Query Expression

Publisher – Chart List

Publisher – URL Parameter Options
The Publisher Chart Tab allows the most common settings to be set. However there are additional settings that can be applied as URL parameters that can adjust or override the Chart’s existing attributes.
For example to change the Legend font size to 14 pixels you can add &fontSizeLegend=14 to the URL address or add this parameter to the Publisher / Report / URL Parameters text input box.
For a full list of URL parameters please see the Web Channel Help
The example a URL address may look like this
http://myserver/mdService1Rest/Chart/?query=ADVW.ChartBar&ctype=bar&chartTheme=flat&showPointLabels=1&plotBandMin=1000000&plotBandMax=2000000&plotBandMin2=6000000&plotBandMax2=8000000&plotBandMin3=8000000&plotBandMax3=13000000&plotBandColor3=red&scaleMax=12000000

Note: There are a maximum of three Plot bands that can be underlayed on the Chart data area. Setting colours for the plot bands is optional as they will already default to green, yellow and red when not set.
Publisher URL Parameters
Chart URL options are put on the URL link to the chart to override some aspect of the chart that may not be available in the Chart user interface or need to be dynamically changed.
These URL options can be set in Publisher by using the Report Tab URL Parameters property.
| URL Option | Description | Example |
| bcolor | Chart background colour can use HTML colours | &bcolor=white |
| chartTheme | Remove chart gradents to make the colours flat | &chartTheme=flat |
| ctype | Override the default chart type | &ctype=pie |
| description | Override the chart description | &description=Expenses |
| fontSizeLegend | Legend font size | &fontSizeLegend=12 |
| height | Overall chart height | &height=800 |
| marginBottom | Set the chart bottom margin height | &marginBottom=0 |
| marginLeft | Set the left Chart margin width | &marginLeft=0 |
| marginRight | Set the right Chart margin width | &marginRight=0 |
| marginTop | Set the chart top margin height | &marginTop=0 |
| plotBandColor | Chart background band colour | &plotBandColor=green |
| plotBandColor2 | Chart 2nd background band colour | &plotBandColor2=yellow |
| plotBandColor3 | Chart 3nd background band colour | &plotBandColor3=red |
| plotBandMax | Chart background band max or ending value | &plotBandMax=40000 |
| plotBandMax2 | Chart 2nd background band max or ending value | &plotBandMax2=80000 |
| plotBandMax3 | Chart 3nd background band max or ending value | &plotBandMax3=120000 |
| plotBandMin | Chart background band min or string value | &plotBandMin=20000 |
| plotBandMin2 | Chart 2nd background band min or string value | &plotBandMin2=60000 |
| plotBandMin3 | Chart 3nd background band min or string value | &plotBandMin3=80000 |
| scaleMax | Maxium value to show on the axis scale | &sclaeMax=10000 |
| scaleMin | Minium or starting value to show on axis scale | &scaleMin=1000 |
| showDesc | Hide or Show the description section 1=Show 0=Hide | &showDesc=0 |
| showLegend | 0=Hide or 1=Show legend | &showLegend=1 |
| showPointLabels | Show data labels over chart 1=Show 0=Hide | &showPointLabels=1 |
| showTitle | Hide or Show the title section 1=Show 0=Hide | &showTitle=0 |
| showToolTips | Hide or Show floating data Tooltips Hide=0 Show=1 | &showToolTips=1 |
| title | Override the chart title | &title=Sales |
| width | Chart width in pixels | &width=600 |
Query Builder Output Name Options
(Requires version 3.1.22 or higher)
| Name Option | Description | Example |
| Area | Chart this output as a area | Value_Area |
| Axis1 | Assigns output value to Axis 1 |
Value_Axis1 |
| Axis2 | Assigns output value to Axis 2 | Value_Axis2 |
| Axis3 | Assigns output value to Axis 3 |
Value_Axis3 |
| Bar | Chart this output as a bar | Value_Bar |
| Column | Chart this output as a column |
Value_Column |
| Dash | Line type is Dash | Value_Dash |
| DashDot | Line type is Dash Dot | Value_DashDot |
| Dot | Line type is Dot | Value_Dot |
| DotDash | Line type is Dot Dash | Value_DotDash |
| Gap | Allows gaps in line charts where no data exists (Nulls will show as gaps not zeros) | Value_Gap |
| Line | Chart this output as a line |
Value_Line |
| LongDash | Line type is Long Dash | Value_LongDash |
| LongDashDot | Line type is Long Dash Dot | Value_LongDashDot |
| LongDashDotDot | Line type is Long Dash Dot Dot |
Value_LongDashDotDot |
| None | Exclude this output when charting data | Value_None |
| Smooth | Line type if smooth |
Value_Smooth |
| Solid | Line type is Solid | Value_Solid |
| Step | Line type is stepped |
Value_Step |
Publisher – Chart Treemap
Technology: Flash – Requres that the Server has Internet access as a online Google Lib in the javascript
Data Format: Group, Label, Numeric Value1

Only the first three columns are used the 4th columns onwards will be ignored

Publisher – Chart Motion
Technology: Flash , Internet port 443 connection requied
Data Format: Date, Label, Numeric Value1 to Numberic Value (n)


Publisher – Chart Timeline
Technology: Flash , Internet port 443 connection required
Data Format: Date, Numeric Value1 to Numberic Value (n)


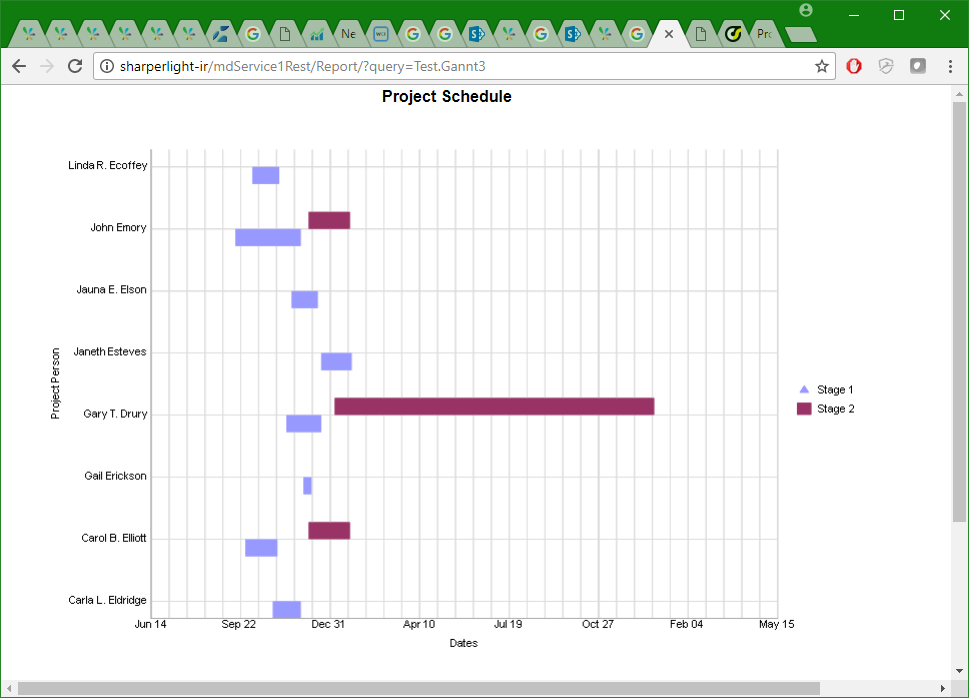
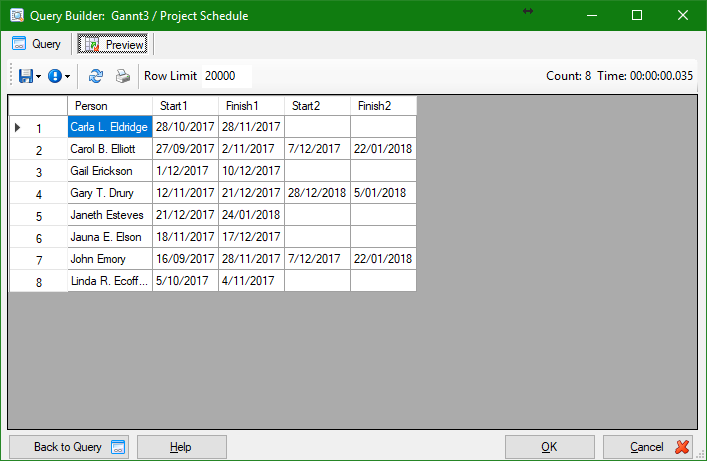
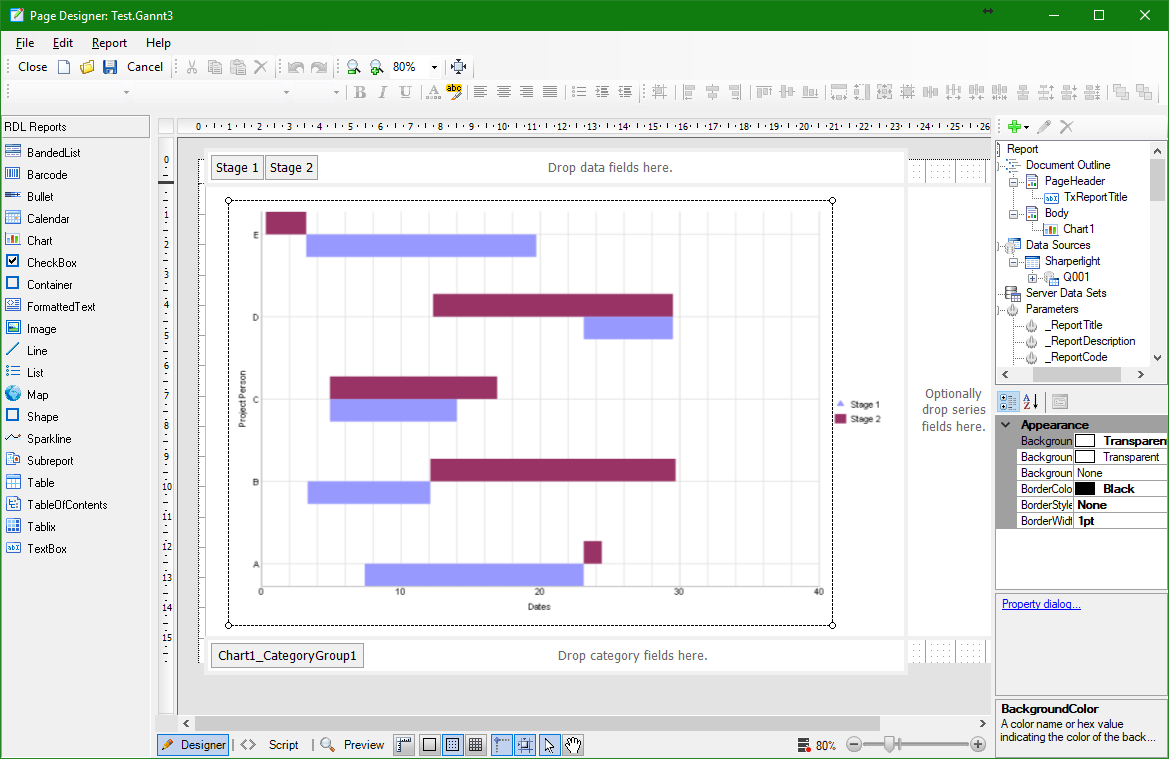
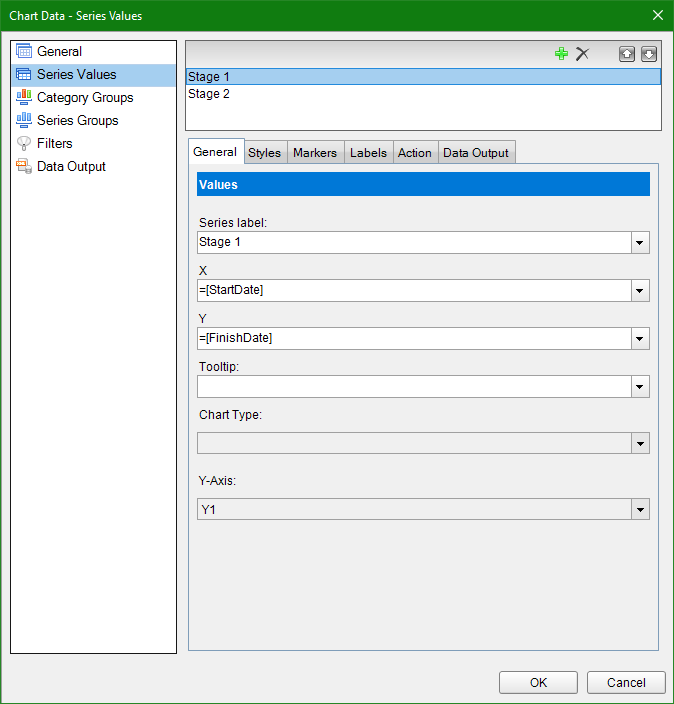
Publisher – Gantt Charts
There are two types of Gantt charts in Publisher:
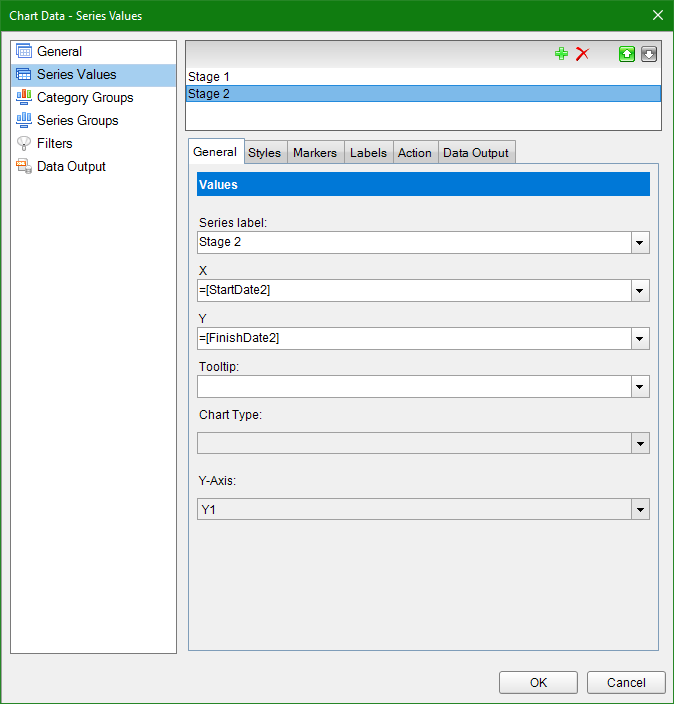
- Page designer Gantt Chart
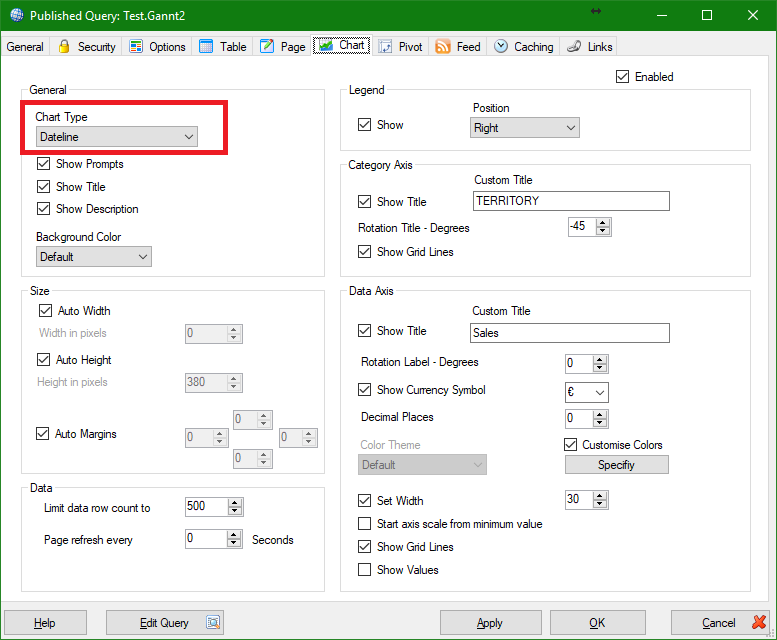
- Dateline
It is possible to create mutliple instances in the same row using either method.
Gantt Charts in Page Designer
Dateline Charts
Technology: HTML / Javascript , Internet port 443 connection requied
Data Format: Group, Code, Start Date, Finish Date
or
Data Format: Group, Code, Start Date Time, Finish Date Time
or
Data Format: Code, Start Date Time, Finish Date Time


Publisher – Chart Calendar
Technology: HTML / Javascript , Internet port 443 connection requied
Data Format: date, numeric value


Publisher – Chart Waterfall
Technology: HTML / Javascript
Data Format: Category / Date, Numeric Value1 to Value (n) where the first value is the starting point

 Publisher – Chart Map – Normal, Terrian, Satillite and Hybrid
Technology: HTML / Javascript , Internet port 443 connection requied
Data Format: latitude, longitude, tooltip, tooltip-line2….tooltip-line(n).
or
Data Format: address, tooltip, tooltip-line2….tooltip-line(n).
Note:
There are Query Builder Expressions that can call out to google for example to convert addresses to latitude and longiture which is required for these chart types.
Look for the Goolgle Maps Folder and Convert Address templates. These calls to Google have usuage limits of 50 per second or 2500 per day unless you have a account.
It is possible to transfer and convert your addresses into a Materialised Query Table so that this conversion does not have to be done in realtime.


Publisher – Multiple Axises and Compound Charts
Hints can applied to the Outputs Names to better control how the data is charted. These hints can override the default behaviour for Chart types and also how the Axis are applied.
Multiple Axises
For example to assign multiple Axises to add _Axis1 _Axis_2 and _Axis3 to the end of the Output Name.
So you can define up to 3 axis’s. If a output name does not have an Axis defined it defaults to _Axis1
Chart Types
To override the Chart Type for a specific Data Field add a hint to the output name that specifies the Chart Type eg. _Bar _Line _Area and _None etc.
For example to have a Line mixed with Column set the default type for the Chart to Columns then on the specified Output add _Line to the output name.
If you want to exclude a Field from the Chart add _None.
Please note that only certain Chart types can be mixed as for example mixing a Pie and Line chart would not make sense.

