
Google Maps – Layered Maps
Sharperlight has integrated mapping features, which allow users to display coordinates outputted from a query onto a Google Maps interface. Users can choose from a wide range of display types (e.g. marker, line, etc.) which includes the types provided within Google My Maps, along with the ability to add extra information and features, such as labels, titles, descriptions, detailed filters, and additional onclick actions.

As shown in the image below, there are quite a few different mapping types to choose from. The Layer Maps are the most recent mapping types to be added. Previously, the mapping types only displayed an object on a map, which was accompanied with a title and label. The Layered Mapping types added new features, such as more on click actions, which allows for a wider array of events, like data entry or drill throughs specific to the object clicked. The layered maps accept extra parameters such as content, information, visibility, value sliders, and much more. However, the mandatory fields in the layered mapping types remain the same, only the title, label, type and coordinates/position are needed to plot objects on the map, which allows for backwards compatibility.

Sharperlight’s map interface allows for many different types of objects to be displayed:
· Marker
· Label
· Textbox
· Symbol
· Polygon
· Polyline
· Rectangle
· Circle
· Box – only requires one set of coordinates, with a field called value for the size of the box.
· Ground – displays an image as an overlay on the map. Requires 4 sets of locations, one for north, south, east and west. These coordinates are responsible for the scale of the image.
· KML/KMZ/Geo JSON – overlay on the map (refer to the overlay section of this article).
Requirements
To be able to use the Sharperlight mapping feature, users first need to get an API key from google. Please follow the instructions here to create the key, https://developers.google.com/maps/documentation/javascript/get-api-key .
After creating the API Key, users need to enable the Maps JavaScript API. Click on the menu button on the top left of the screen. Under APIs and Services, click on Library. Find Maps JavaScript API (if not visible on the library home screen, type it into the search bar) and enable it.


Once API key has been fully set up, there are 2 ways that they can input the code into Sharperlight.
- In publisher, under the charts tab, when a map type is selected, there will be a section to enter the API key.
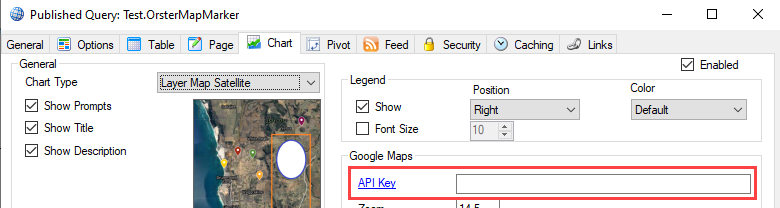
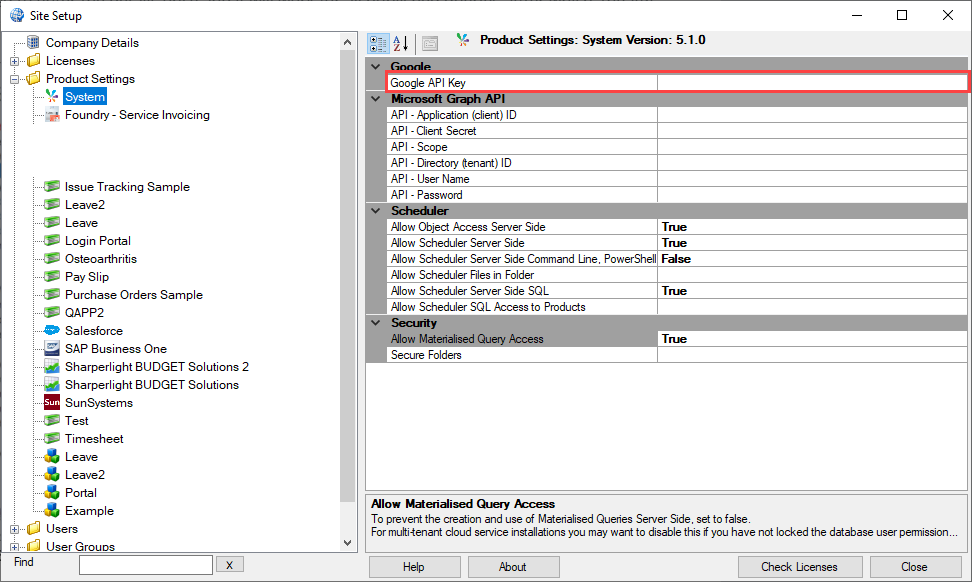
- Alternatively, users can enter site setup and enter the details there. This is recommended as users only need to enter the details once and it will work for all published queries. After which, the API section in published queries can be left empty.
Creating a Basic Map
Open Publisher and create a new published query.
The query needs to output the type of the indicator (marker, line, etc.), the position/coordinates, title and label. Make sure that the output fields are named accordingly.

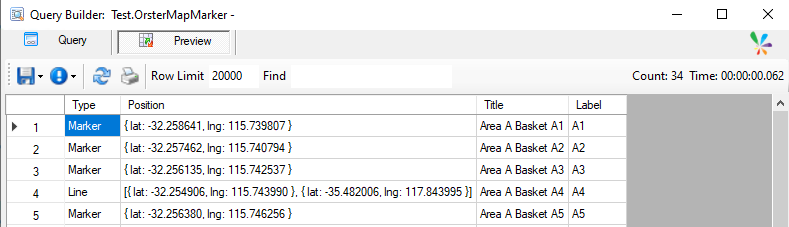
- As seen in the table above, different types require different amounts of coordinates, which is to be expected. For example, markers only require one set of coordinates, where a line would need start and end coordinates. Users need to provide these coordinates, which can be done by either pulling data from the database (if applicable) or creating a custom defined dataset.
- A custom defined dataset allows users to create a query based purely on the values they manually provide within the query itself. However, it is only useful if users know exactly what they want to display and the coordinates for each of the points. It is not dynamic and will not grow unless the query is edited and the data is typed in manually. To create a custom defined dataset, refer to the instructions and the image below.
- Set the Product as System and the table as Custom Defined Dataset.
- Double Click on Define Dataset. Define the field names.
- Users can either type in the values separated by a comma for each field and new line for each record, or click on Grid Edit and type into a grid interface.

Make sure to change the type to Chart. Go to the chart type and select one of the layer map options. Please ensure that the Google API Key has been set up (see Requirements section).

The query specified above will produce multiple objects on a map. All of which will have a label shown. When hovered over, the object will show the title specified. This is a very basic map and serves as a starting point, there are many more features that will be discussed in the following sections.

Adding Additional Features
As mentioned earlier, there are many additional features that can be added to the basic map that was just created.
Open the Basic Map published query and edit it.
Add additional fields to the output section (can be expressions) and make sure their names match the available fields listed below.
Type (Mandatory)
The type of the object the user wants to display on the map (e.g. Marker, Line, Rectangle, etc.)
Position/Coordinates (Mandatory)
The longitude and latitude of the object. Different object types require different amounts of coordinates.
Title (Mandatory)
Tooltip that is shown when hovered.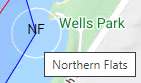
Label (Mandatory)
The short label that is shown on the map alongside the object.
Content
This is displayed in an overlay when the object is clicked. This can contain text or a url to any webpage, which includes published reports, dashpages or writeback entry pages.
Info
This takes the same inputs as Content. When an object is clicked, this will display under the filters section on the right. 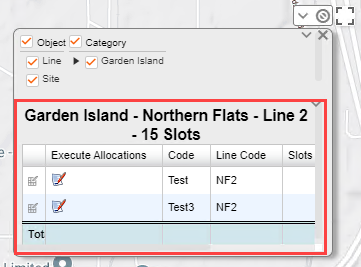
Range (Number Range Slider)
This is a slider filter. Will be shown together with the other filters. Make sure the output name is set as Range. Note the min and max values are auto calculated based on the dataset.

Colour
Accepts names of colours (i.e. red, blue, yellow, etc.) or html codes.
Style
Additional styling edits can be applied to the object. These additional styles include:
· Radius
· strokeColor
· strokeOpacity
· strokeWeight
· fillColor
· fillOpacity
· geodesic
· zIndex
· xlabelY
Multiple style values should be separated by commas. For example,
xlabelY:5,strokeWeight:2,zIndex:3
Zoom
If the user is zooming in and out, the object will only start to appear at a specified zoom. By default, the object will always be visible at any zoom level. If the value is positive, both the object and the label will be affected by the zoom, if negative, the object will always be visible and the label will be affected by the zoom.
Visible
This field affects the filter selections. When set to true, this filter will always be selected when the page is first loaded.
Select
When set to true, this object on the map will be selected (there will be an arrow above the object and it will “bounce”). This is the same affect as clicking the object in the filter section. 
Value
This is used if the type is set to textbox, box or circle, it specifies how big the box will be. The units are in meters.
Url
This is used if the type is set to textbox, ground or KML. It will display what is in the URL. For example, ground displays an image overlay, which will be based on the URL provided.
Adding Filters
Sharperlight also provides a filtering section that appears in a form of a legend on the map.
To create a filter, add a field to the output section and make sure the name does not match any of the additional features listed above.
If the user wishes to have a hierarchical filtering system, then the values in the desired field would have to be separated by a “\” (parent\child). For example, “\Garden Island\Northern Flats\Line 1”.

Adding an Overlay (KML/KMZ/Geo JSON)
Sharperlight allows users to add overlays to the map in 3 different formats: KML, KMZ and Geo JSON. Geo JSON is the open standard, whereas KML and KMZ are the google proprietary file types. KMZ is a larger zip file and needs to be used if there are binary icons and custom images.
Google has a product called Google My Maps that allows users to create a map with their desired objects. After which, they can export it as either a KML or KMZ file. There are many tutorials online, detailing how to use Google My Maps. Their support website is also very useful https://support.google.com/mymaps. Since Sharperlight provides more object features than Google My Maps, users can add these features as text values, by editing the object on Google My Maps, for example,
<meta>
<label> Ex1 </label>
<title> Example </title>
</meta>
Once the file has been obtained, it can be imported into a Sharperlight published query and displayed as an overlay. The imported objects will then have the data for the extra features, which will be shown in the Sharperlight map interface.
Follow the instructions below to import an overlay:
Open up the published report.
Click on Resource. Create a new resource, select the KML/KMZ/Geo JSON file. Copy the link created.

Navigate to the Chart tab. There will be a section to input KML, KMZ and Geo JSON files. Paste the link here.

Alternatively, users can edit the query, create a union to their existing query, select the product as System, and the table as KML/KMZ and paste the link there. This option allows users to have more control over what is outputted. It allows users to look evaluate and edit the data before viewing in the map interface. If users experience some errors, try setting the Content Type to the correct file type (i.e. KML or KMZ).

Options

Limit data row count to
This limits how many objects can be placed on the map.
Page refresh every
Refreshes the map every x seconds. Can be very useful if data is being written into the database constantly.
Legend
These options relate to the filters overlay on the map.
API Key
As discussed earlier, users need to make a Google account and obtain the API key, and paste it here. If users have already set it up in site setup, leave this section blank.
Zoom
This will be the default zoom when the map is first loaded.
Centre
This will be the default coordinates that the map is focused on when the map is first loaded. If left blank, the map will center on the first coordinate in the data output.
Offset Y and Offset X
This relates to the object labels. Allows users to position the labels, relative to the object themselves. Offset is in meters.
Heatmap
If the type of the object is “Heat”, users are able to specify the colour, size and opacity of the object. Alternatively, on the map interface, there are buttons that allow users to change the colour and size of the object. 
Overlays
Users who have a KML/KMZ/Geo JSON file which contains object information can paste the link here. Refer to the “Adding an Overlay” section above for more information.