
Page Designer – Maps Displaying Spatial Data
The Publisher Page Designer Map control can display various geometry and geography spatial data based on the results of one or multiple query results. The Map control supports multiple layers, each of which can be bound to a different query dataset. For example one map layer may be used for the general border of an area while another layer could show the path of a truck. The colours of the areas or lines can be based on some value in the query for example a percentage complete or volume. Drill Through is also possible by creating bookmark click actions that open another report and passing various parameters on the URL. The final report can be viewed on in the Web Channel as HTML or PDF. It is possible to use the Report viewer on the desktop to view the map and the scheduler can also use the report to save to PDF and attach to a email based on parameters for example.
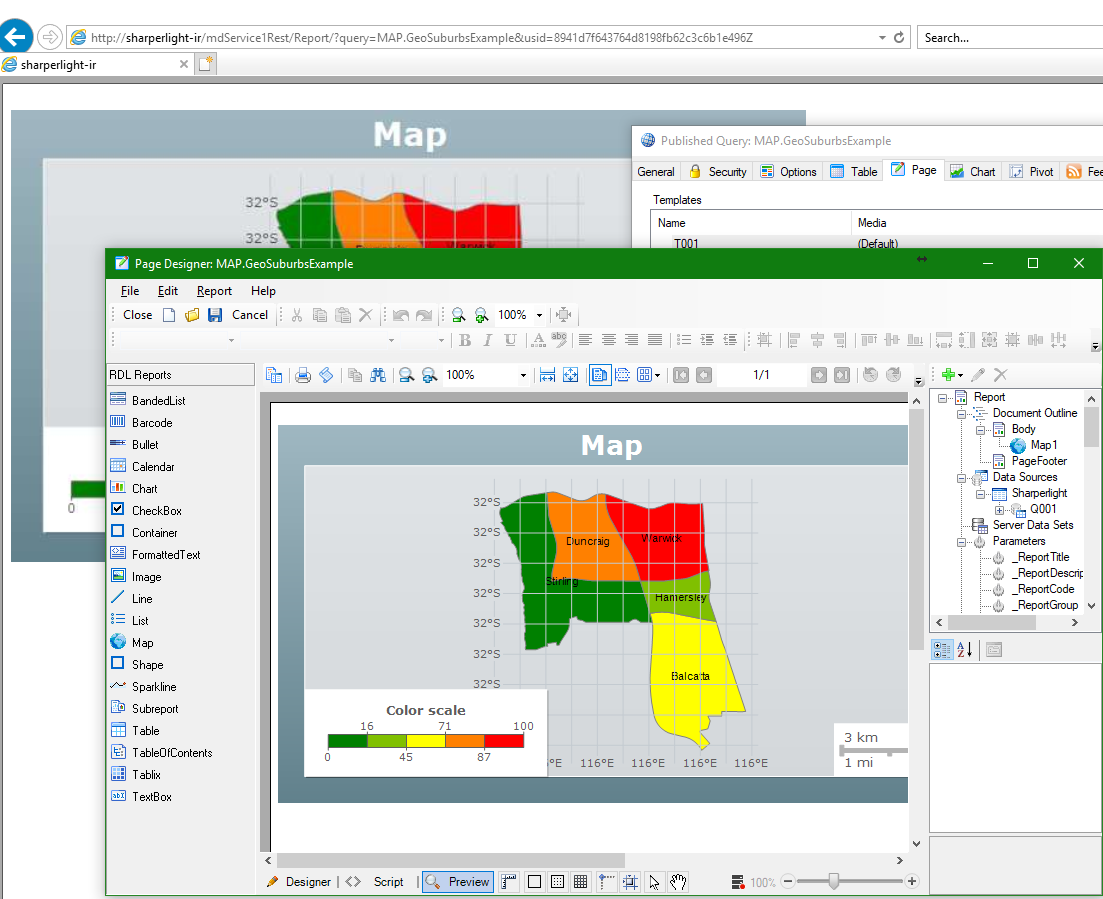
This example will be kept as simple as possible and will display five suburbs and base the colour on a rating scale of 0 to 100. The label will show the suburb name and when click will create a URL address to show the Suburb details.
Binding queries to the MAP control requires Sharperlight version 4.7.67 or higher
Example
Download MAP example and import into Publisher
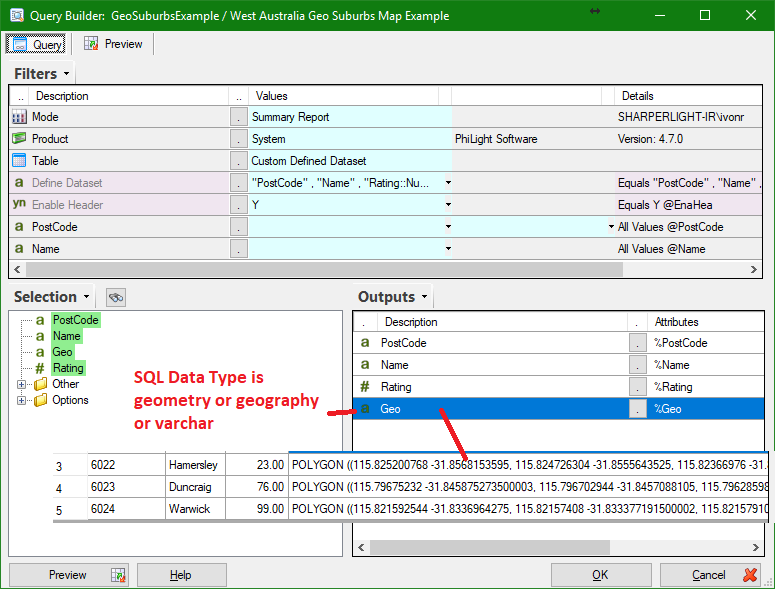
Create a query to get the spatial data in Publisher
You will know what is spatial data because it will show keywords like POINT, LINESTRING and POLYGON etc. It does not matter what the database data type is as long as you can see these types of keywords.
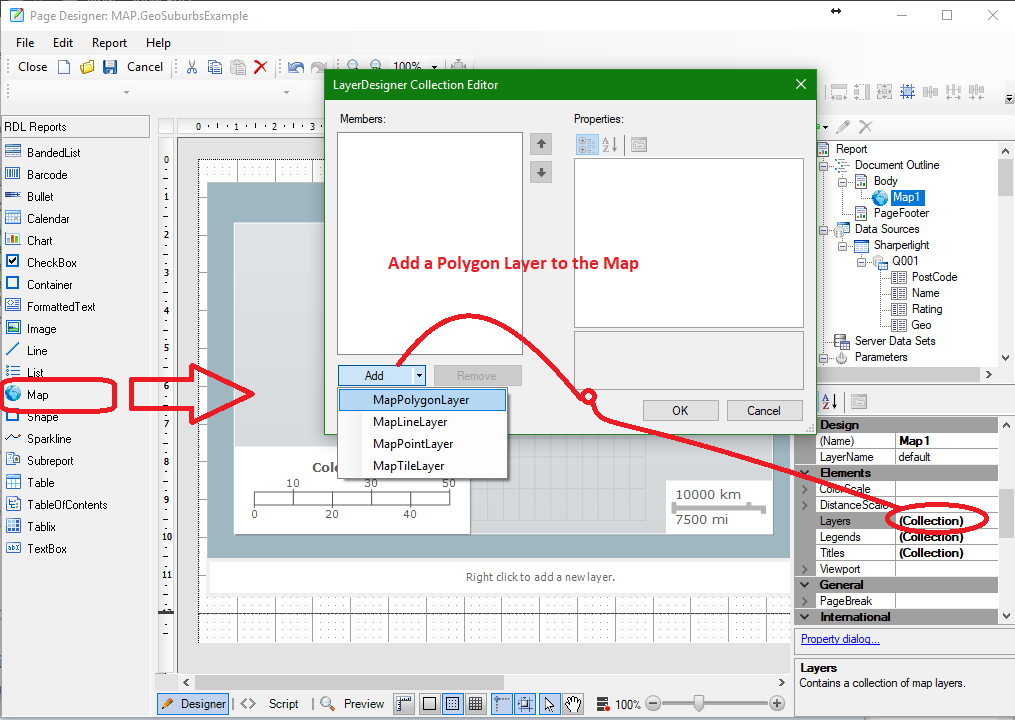
In Publisher Page Designer – Add the Map object and a Layer
In this case we will add a Map Polygon Layer
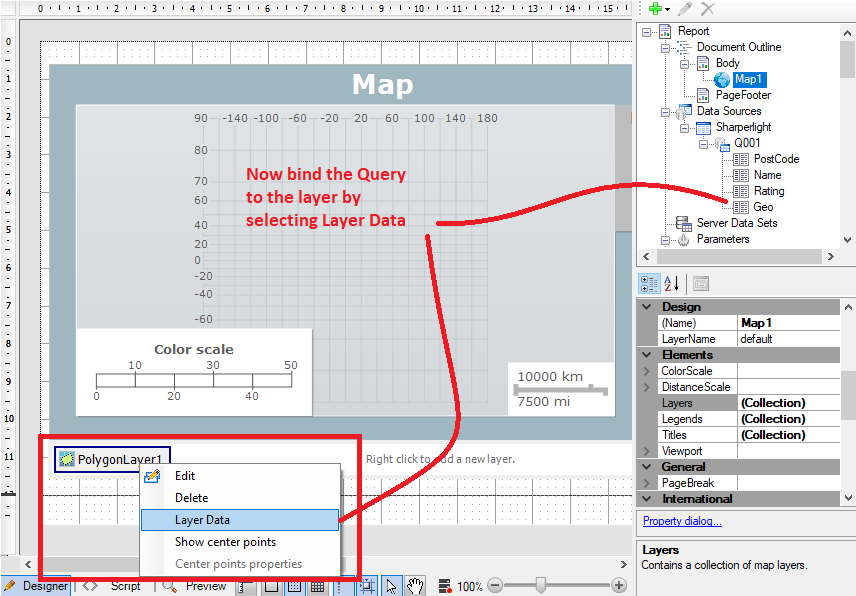
Bind the query data to the Map Layer
From the right click menu select Layer Data
Map the query spatial field
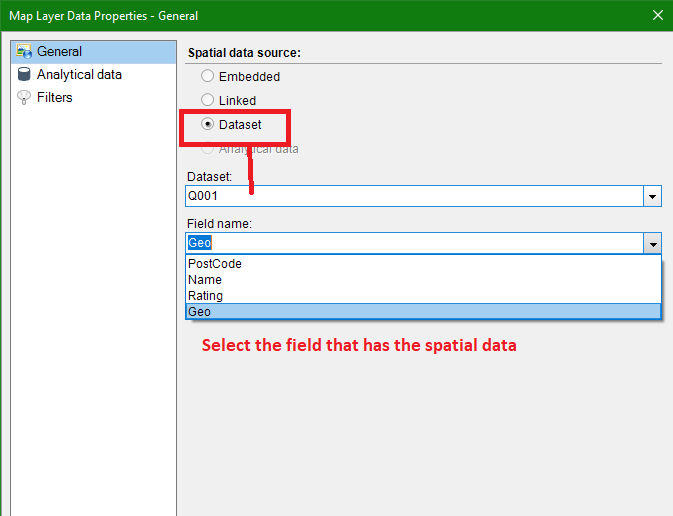
On the General tab select Dataset and then the Query code and finally the Field name. The Field name is the field that contains all the spatial data like POINT and POLYGON etc
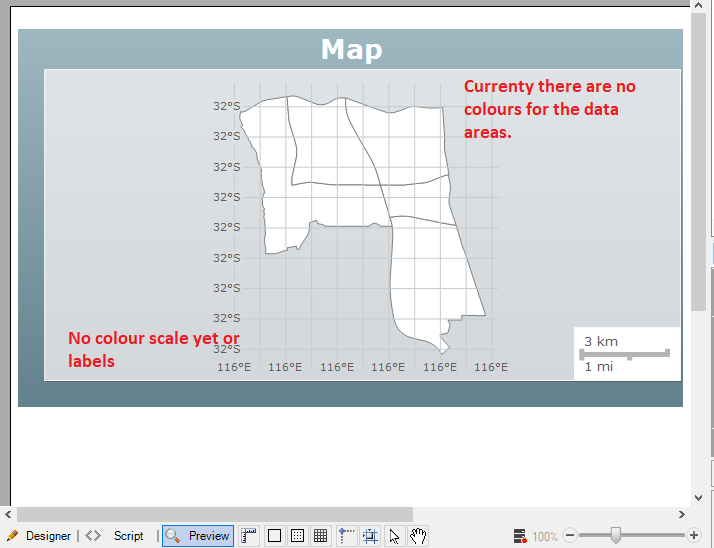
First preview before adding colour scales
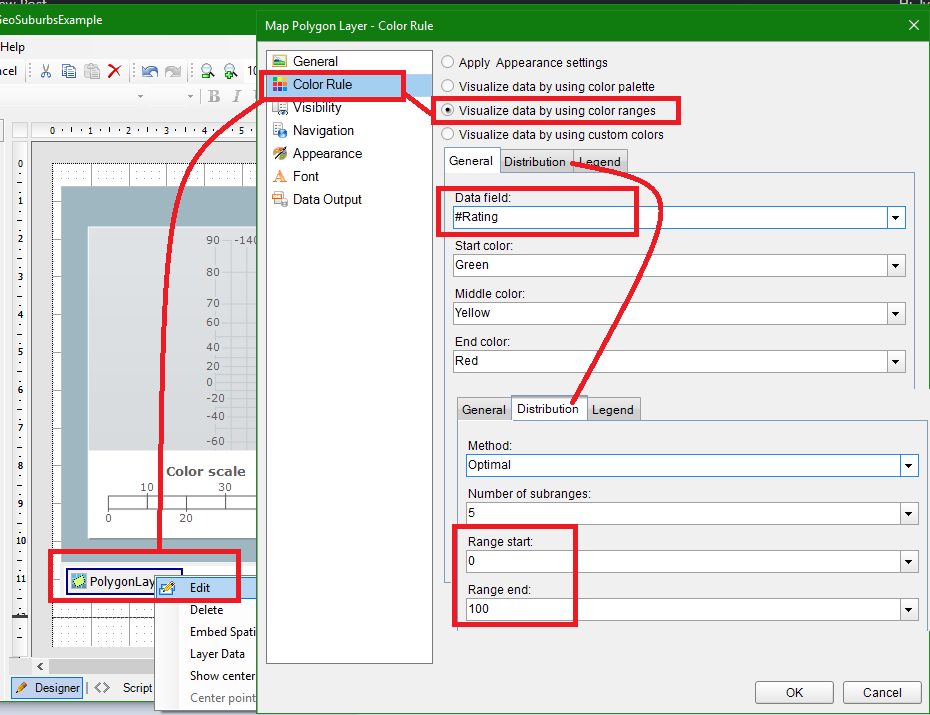
Setup a Colour Rule based on a query field
In this example the colour will be based on the field Rating which is a value between 0 and 100. Select the layer at the bottom of the map and on the right click menu select Edit. On the Colour Rule tab select Visualise data by using colour ranges then select the Data Field. On the Distribution tab you can set the Start and End Range values. You can also allow the colours to be auto allocated if there is no meaning to the colour other than a different area.
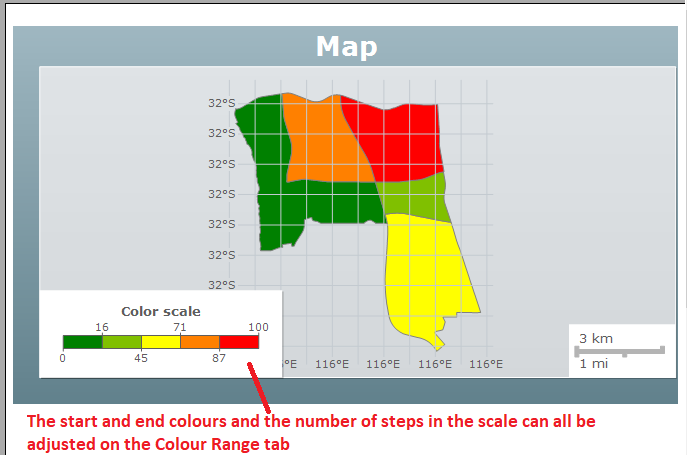
Preview the Colour Range Map
Now area area has it’s colour determined by the Rating Field.
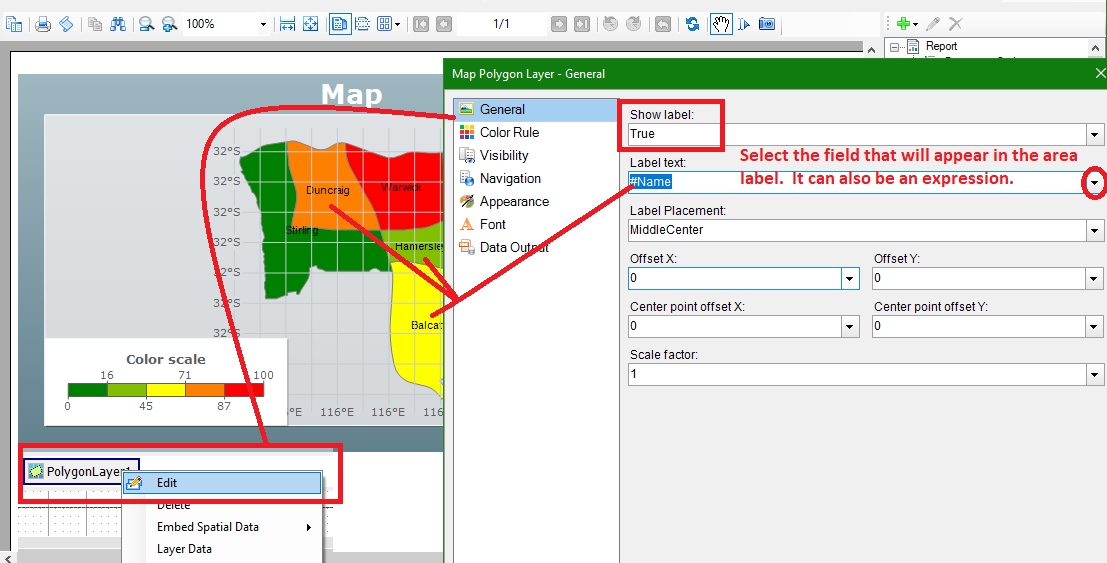
Select the field that will appear in the label for each area
On the general tab you can set the Show Label to True and then select the field that will be used to drive the label.
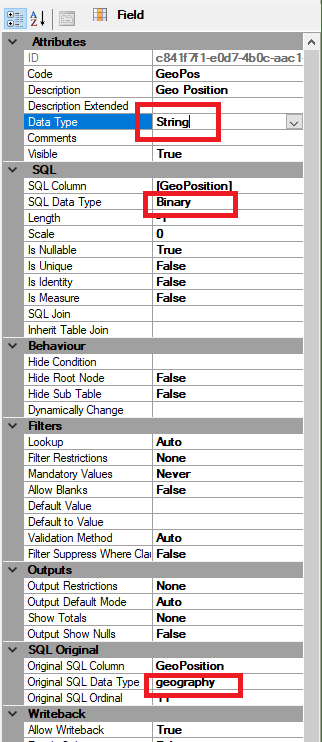
What the Database Table data might look like
If you using SQL Server you will find that spatial data can be stored in columns with a data type of geometry or geography. However Sharperlight does support varchar data types as well. The important point is that the spatial data is valid and contains data like POINT, POLYGON etc as defined by the standards. SQL Server spatial data types are stored as a binary image so you will need to cast( as varchar(max)) to be able to read the content. If you creating a Custom Table or Datamodel just leave the SQL Data Type as Binary and the User Data Type as String
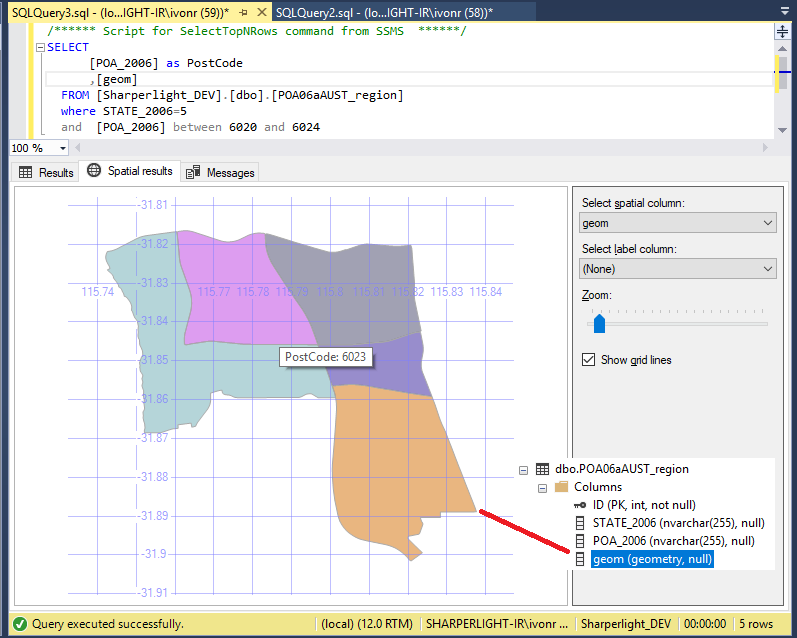
Custom Table or Datamodel Field Properties
If your using SQL Server geometry or geography data types you will need to check your Field Properties are set as follows. Data Type should be String and the SQL Data Type is Binary. The orginal data type can be set to geometry or geography as this will assist the writeback logic in converting the spatial text back into the binary data types
What is Spatial Data
Spatial data is a set of coordinates that defines a map element. Each map layer must have spatial data of one of the following types – a polygon, a line, or a point.
Spatial data can be either embedded in a map or can be linked to a map layer. The only difference between the two is that while having the spatial data embedded in a map, there is no separate file to locate or to keep track of when you move the report between projects or machines.
See the following for more details
Embedded Spatial Data:
Embedded spatial data can refer to the following:
Embedded ESRI shapefile or dataset: When you use the Embedded option in Map Layer Data
Properties dialog or the From ESRI file option in the Map Wizard to import spatial data from an ESRI
shapefile, the ESRI shapefile gets embedded in the Map. Similarly, if a report dataset is been used to provide
spatial data to a map layer, you always have an option of embedding that spatial data in the map using the
Embed Spatial Data option that appears in the layers pane. See, Use Layers to learn embedding spatial
data to a map.
Dataset:
The spatial spatial data will be derived from a field in a query