
Report Schedule over time slots by weekday example
This example report touches on many different concepts in the Query Builder like Date Series, Dynamic Columns and Sub Queries. The object of this example is to show how activity over weekdays can be shown by a specified time interval. The activity in this case will be what applications were access in Sharperlight but the Sub Query that retrieves this data may be changed to for example, show what clients have bookings for that day and time slot by using the same pattern.
The report query can be summized as follows. The main query uses the Date Series Table in System to get a list of Dates and Times at the specified interval. To make this more interesting we have started at 06:55 and only shown 25 intervals from there up to 17:45. A Dynamic Column was created by binding the Report Date Range Filter to an Output and also a Sub Query to build the data matrix. The Sub Query filters reference the Date and Time and returns all the applications used during that period. Because Sub Queries can only return one row the many different applications that were used for that period are concated into one result using an expression while another expression ensures just the last row is returned. To get the captions on the column to show the date with the weekday a expression was used. Because we want to stack the list of Applications on top of one another instead of list them side by side another Dynamic Column Expression was created that referenced the Sub Query result and formatted it using HTML and a break tag to force each new entry on a new line
How to use this example
Use the Publisher / Load menu to load the file. It should work as is on your System as it uses the Sharperlight User Access Log Table as data. The next step would be just to modify the time interval filter values and Sub Query to target the data you wish to show in the Data Matrix
Download Example Publisher Report
 Test.WeekSchedule25Min.pbq
Because the Example Report is using the Sharperlight User Log as it’s data it should also work on your System

Parent Query
Create the Basic Query over the Date and Time
Use System and the Table Series and Filter the Date range to pickup the last week or the coming week.

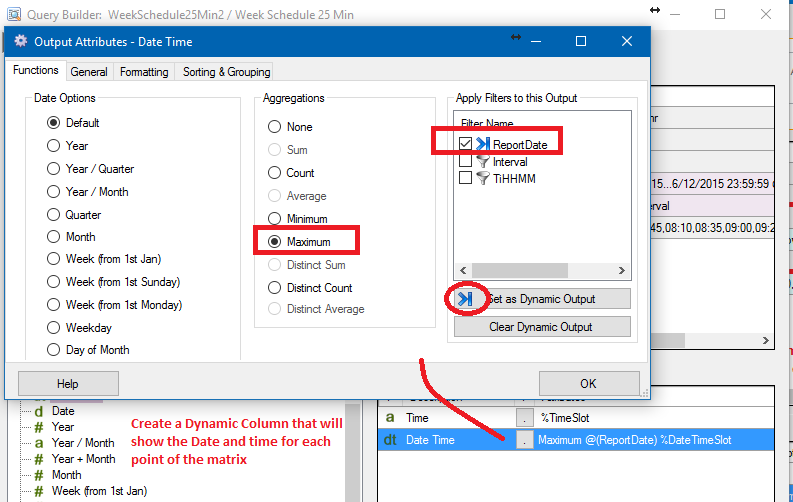
Create the first Dynamic Column that will put a Date and Time in each point of the Matrix by binding the filter named ReportDate to the output
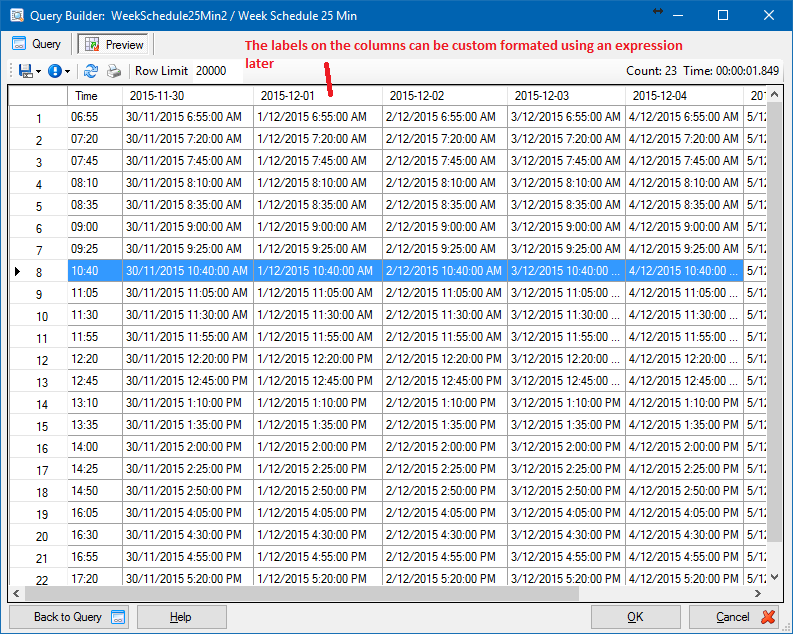
Preview the Data of the Query so far
The labels on the columns can be custom formatted later by using an expression. This date and time will later be hidden but it’s required to build the data matrix to which the Sub Query can ride on.
Sub Query
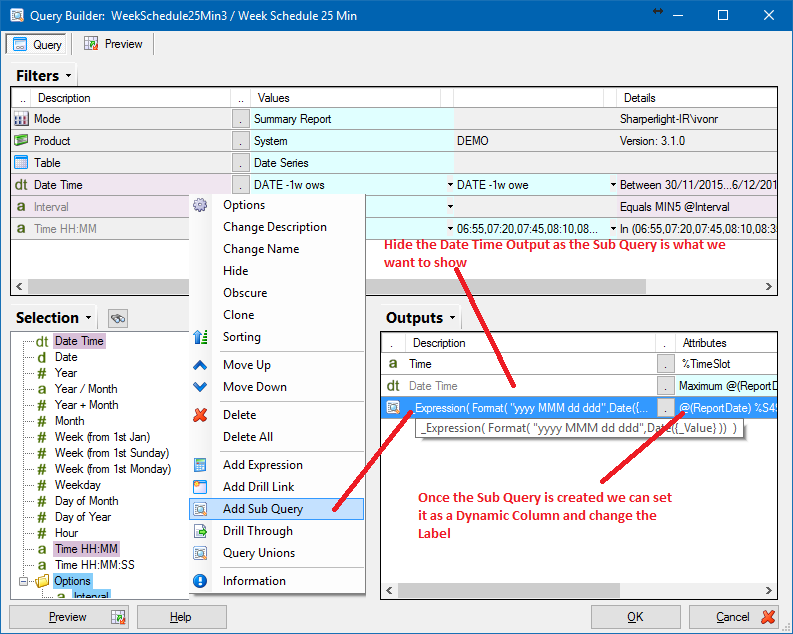
Create the Sub Query to target the data you wish to show in the Data Matrix based on the Date and Time
Hide the Date Time Output as the Sub Query is what we want to show
Once the Sub Query is created we can set it as a Dynamic Column and change the Label
Define the Sub Query and reference the Date and Time Slot in the Filters
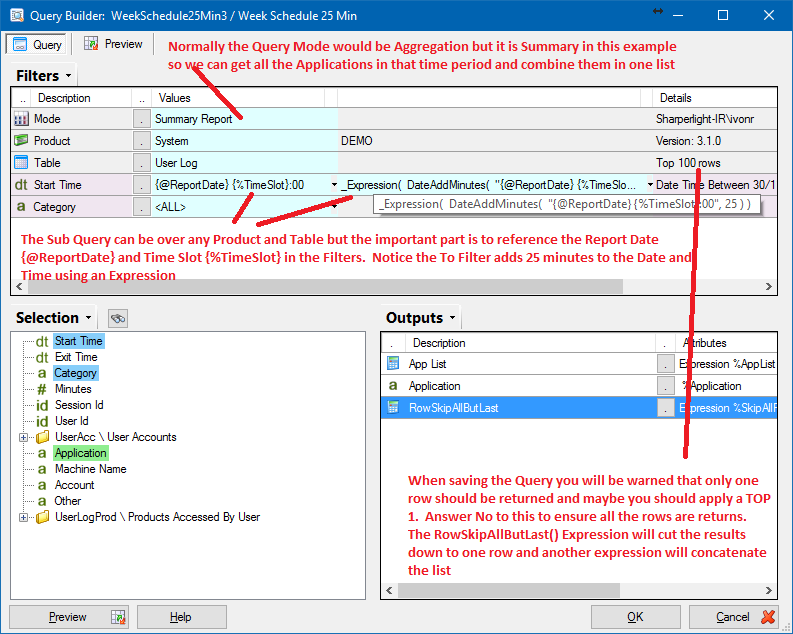
Normally the Query Mode would be Aggregation but it is Summary in this example so we can get all the Applications (or in your example maybe Clients) in the time period and combine them into one list
The Sub Query can be over any Product and Table but the important part is to reference the Report Date {@staging-sharperlight-com.stackstaging.comReportDate} and Time Slot {%TimeSlot} in the Filters. Notice the To Filter adds 25 minutes to the Date and Time using an Expression
When saving the Query you will be warned that only one row should be returned and maybe you should apply a TOP 1. Answer No to this to ensure all the rows are returns. The RowSkipAllButLast() Expression will cut the results down to one row and another expression will concatenate the list
Filter On the Date Time using an Expression
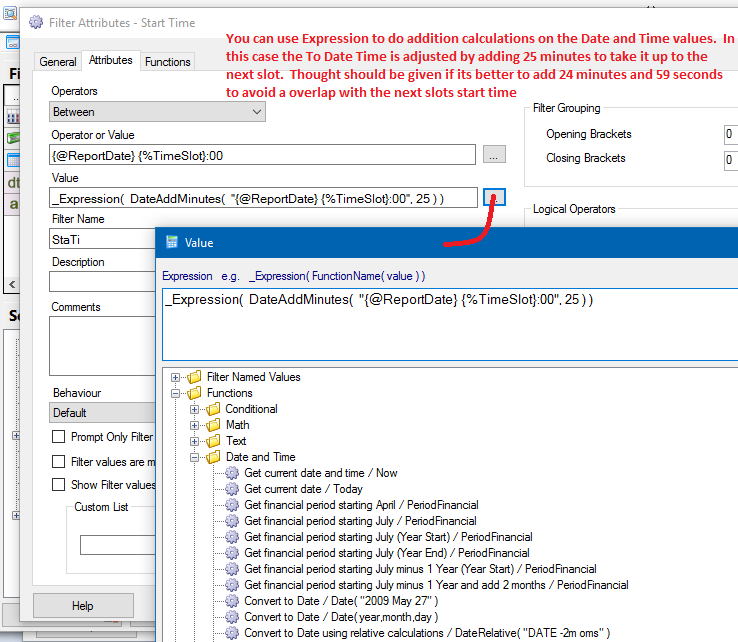
You can use an Expression to do addition calculations on the Date and Time values. In this case the To Date Time is adjusted by adding 25 minutes to take it up to the next slot. Thought should be given if its better to add 24 minutes and 59 seconds to avoid a overlap with the next slots start time
From Filter Value
{@staging-sharperlight-com.stackstaging.comReportDate} {%TimeSlot}:00
To Filter Value
_Expression( DateAddMinutes( “{@staging-sharperlight-com.stackstaging.comReportDate} {%TimeSlot}:00”, 25 ) )
Create Expression to combine all the values into one list
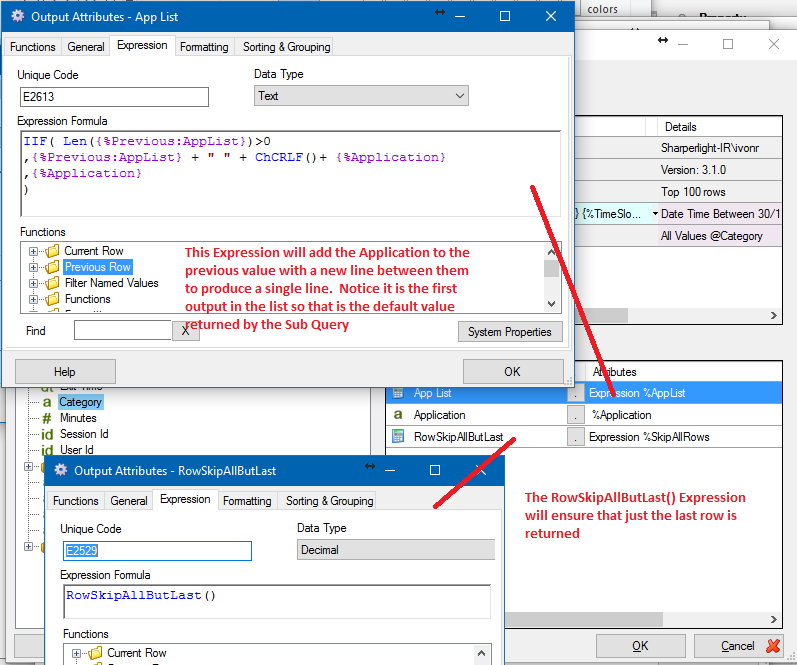
This Expression will add the Application to the previous value with a new line between them to produce a single line. Notice it is the first output in the list so that is the default value returned by the Sub Query
The RowSkipAllButLast() Expression will ensure that just the last row is returned
Prompt to apply Top 1 Rows – Answer No
When closing the Sub Query you will be warned that normally Sub Queries should only return one row and would you like to force a TOP 1 row. Answer NO to this as we want all the Applications / Client Names fo the specified period and the RowSkipAllButLast() Expression is reducing the result down to the last row.

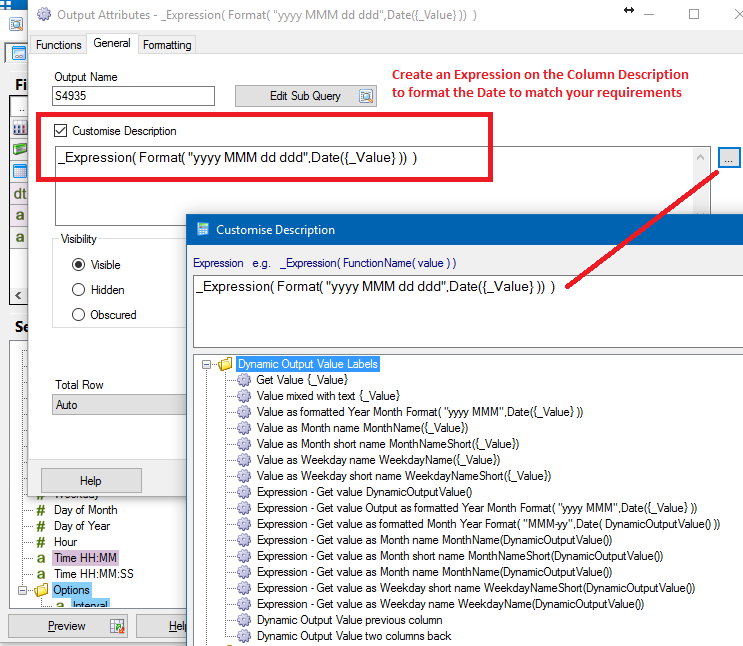
Create an Expression on the Column Description to format the Date to match your requirements
_Expression( Format( “yyyy MMM dd ddd”,Date({_Value} )) )
Make sure you set the Sub Query as a Dynamic Column that is bound to the Report Date Filter

Preview Query Data at Parent Query Level to see the results of the Sub Query
Notice that currently the Application list is shown on one line. This can be adjusted in the next step by handing this value to another expression which can do HTML formatting to force a line break

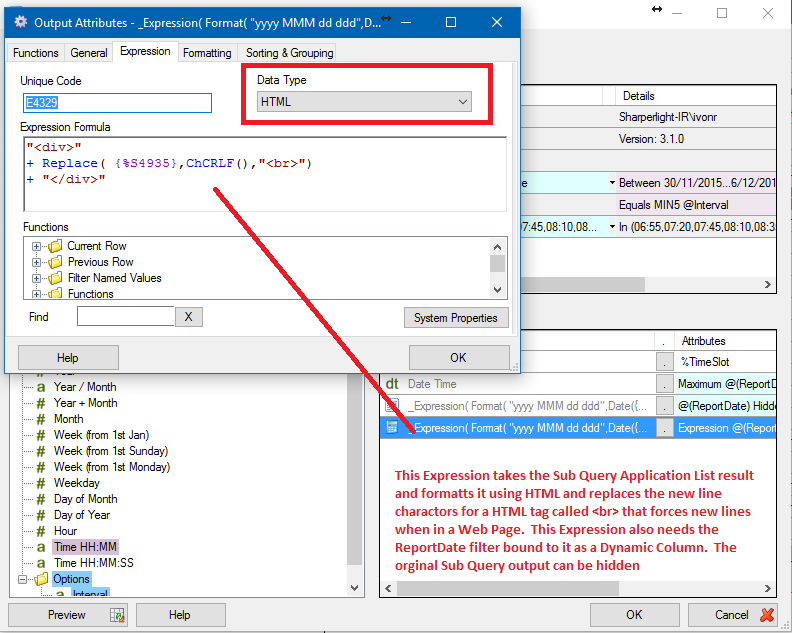
Create an Expression to force each entry for the Time Slot to appear on the new line
This Expression takes the Sub Query Application List result and formatts it using HTML and replaces the new line charactors for a HTML tag called <br> that forces new lines when in a Web Page. This Expression also needs the ReportDate filter bound to it as a Dynamic Column. The orginal Sub Query output can be hidden
Preview Report Data and then View in Web Browser

Preview Report in Web Channel as seen at start of article