Page Designer – Using Matrix to pivot data
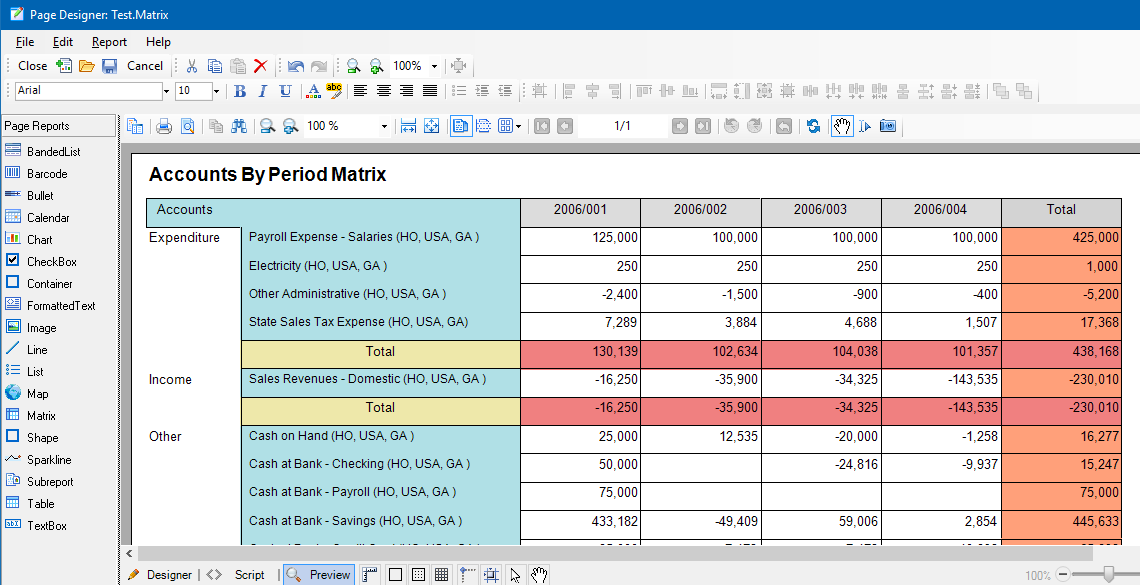
Publisher Page Designer can handle various layouts when dealing with data and the most common object to display data is the Table object. However only the Matrix can pivot data where you have labels going down and across with the sum of that cross section in the middle. This article shows a simple Accounts by Periods with Balances with a Total on the right and bottom. The Query is based on SAP Business One but any data source can be applied to these concepts
Preview of Final Page Design
Create the Query Data
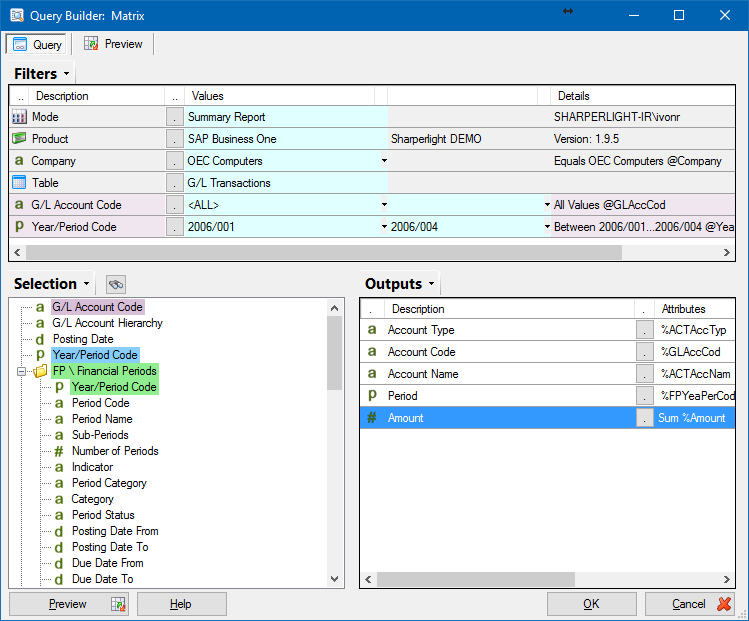
In Publisher Query Builder define the data that will feed the Page Designer Matrix
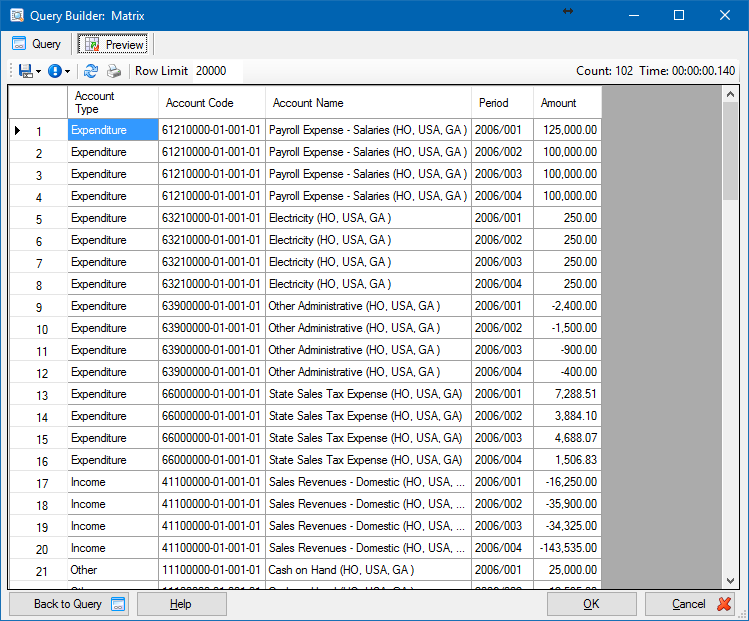
Preview the Query Data
Create the basic Matrix
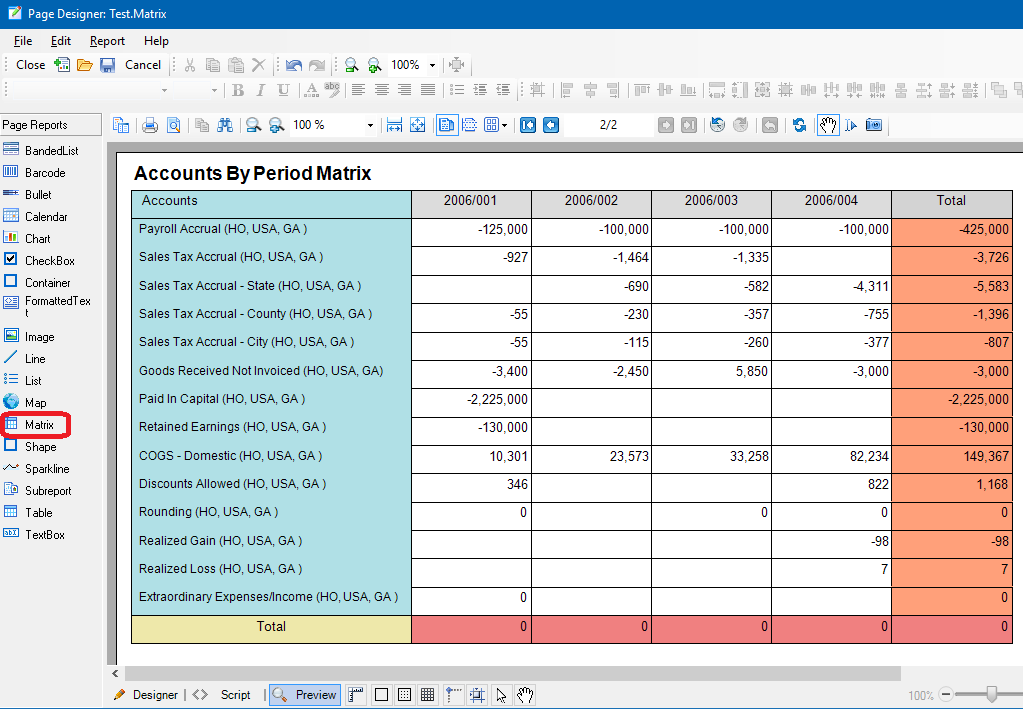
Clear the Report Body section by deleting the sample Table object. Then drag and drop the Matrix object into the Report Body Section
The Matrix will have four cells to start with. In the top left cell type ‘Accounts’ then in the other cells use the drop down list selector to select the Field you want to display. The bottom right cell will be the Measure so select the number value from the list and notice it will automatically put a SUM on the front.
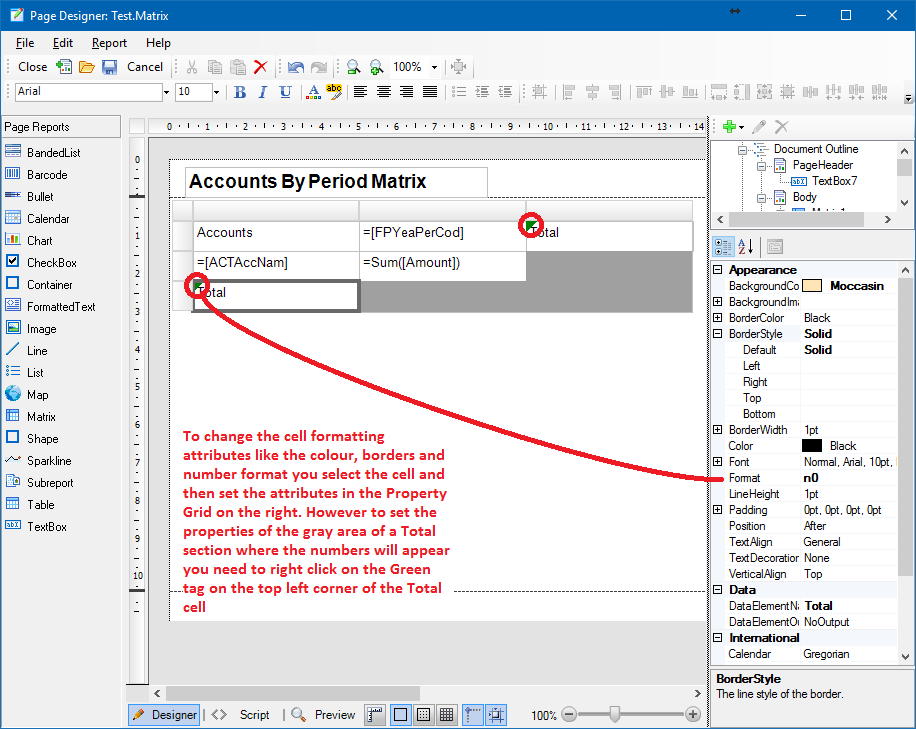
Use the property grid to change the cell formatting like borders, background colour and number display format

Create Totals going down right hand side
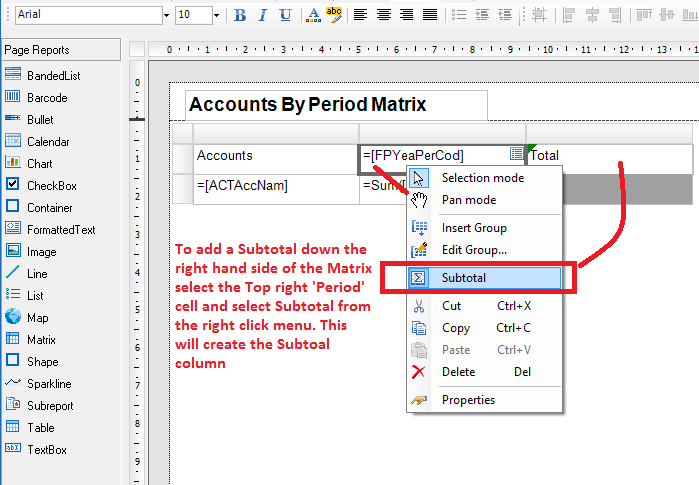
To add a Subtotal down the right hand side of the Matrix select the Top right ‘Period’ cell and select Subtotal from the right click menu. This will create the Subtoal column
Create Totals along the bottom of the Matrix
To place a Total row at the bottom of the matrix, right click the bottom left cell where the Account Names field is present and select Subtotal. This will create a Total row below

Cell Formatting
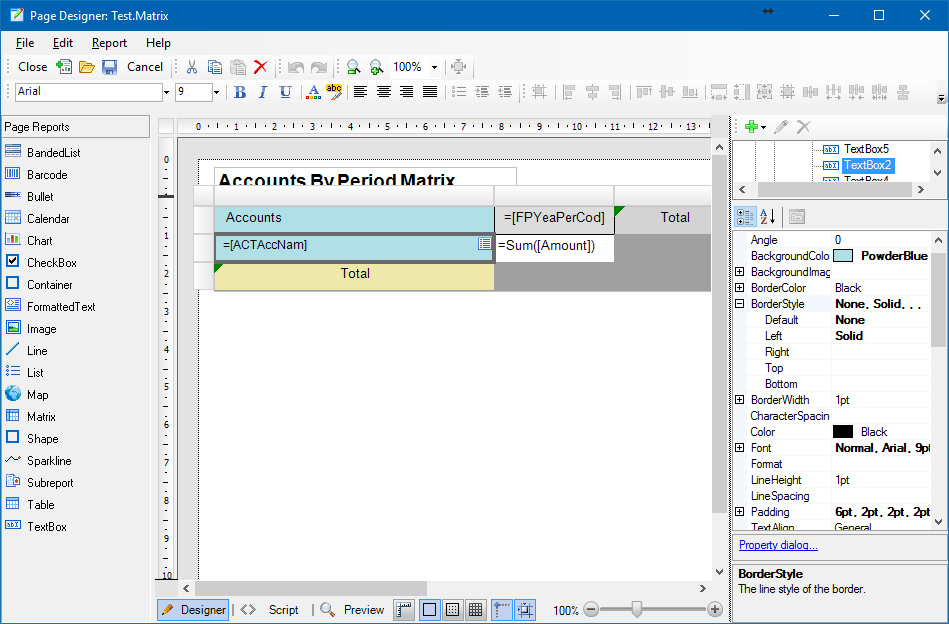
Final Formatting
Preview of the Report in the Web Channel
Now the design is completed close the Page Designer and on the Publisher Report set the Default Type to Page PDF or Page HTML. Then copy the URL link to the report on the Links tab and paste it into your address bar of the browser.

Add more Groups to the Matrix
Add another Row Group so we can show and Total the Accounts by Account Type

Set the Grouping Field

Set the Account Type Field to display in the Grouping Cell

Preview Grouping Matrix Design