Page Designer – Dynamic Columns – Conditionally Hiding Columns
Reports with dynamic columns present a challenge to the Page Designer when using Table object to display the data because the columns must be predefined. The Page Design Matrix object does solve this problem by pivoting the data but it has a very strict layout where you can only have one measure in the pivot area so creating a Opening Balance would very difficult. On the other hand the Table object can very easily have a column for a Opening Balance for example, then a column for each Period/Month in the current year and finally a overall Total. The issue with using the Table object would be that as the year progresses there will be a increasing number of Period/Month columns from 1 up to 12, where in the middle of the year we would only see 6 columns and at the end of the year all 12 columns with the appropriate labels at the top. This article will show how you can dynamically hide columns in a dynamic column range and also adjust their labels to match the filter range.
If the report did not use the Page Designer but rather HTML then having dynamic columns would not be an issue. However sometimes you may require a report that combines charts, tables and various sections into one PDF document. This would be an example where this pattern would be useful.
Download Example
The example used to show how to dynamic hide columns will have Account details on the rows with a Opening Balance, Dynamic Columns for Amount by Periods/Months up to the current Period and finally a Total for the Year to Date. In the screenshot below the Period columns are driven by the Period Filter so as the year progresses the to Period will increase from 2011/006 to 2011/007 etc up to the final Period of 2011/012
Please see the article on Dynamic Columns to understand how these work.
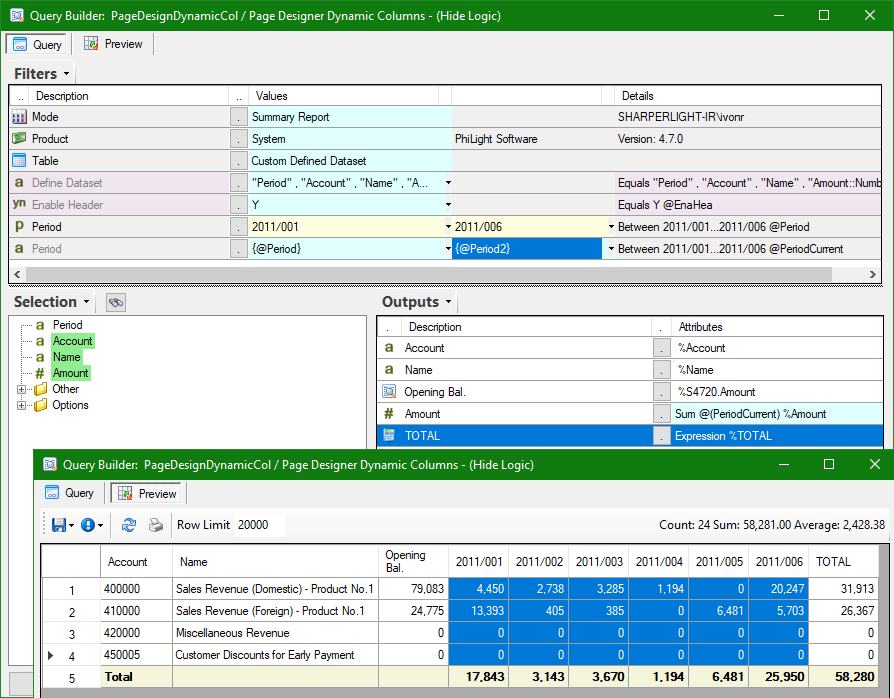
Define the Query and set the filters so the maximum possible columns are present
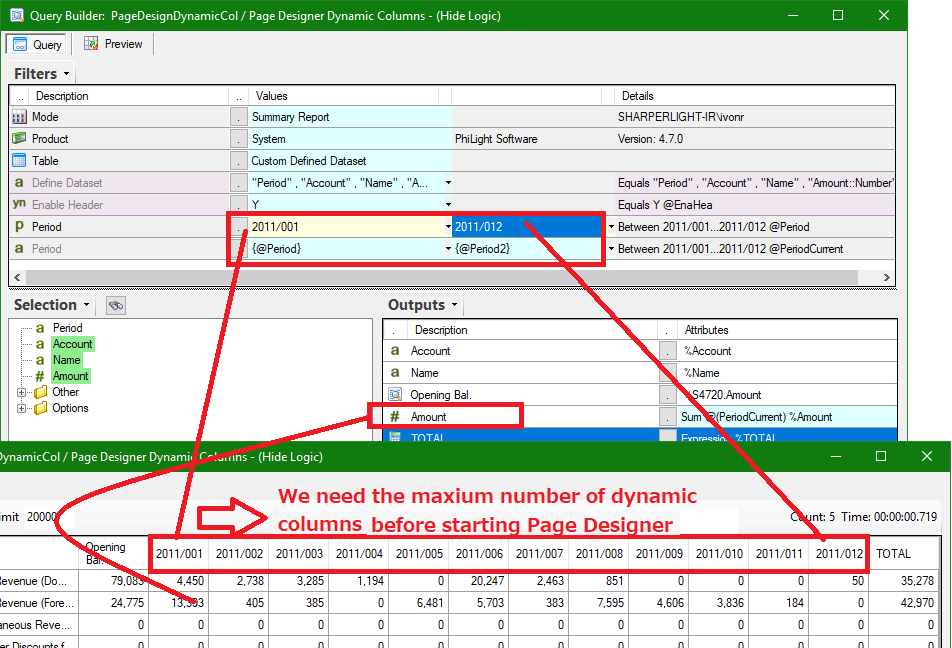
The Page Designer cannot dynamic add columns, it can only have static columns and a Field bound to each column. So we need to change out report query to initially have the full set or the maximum number of columns so out Page Designer can reserve the column slots for the dynamic range. In this example we will change the Period Filter Range from being 2011/001 .. 2011/006 to 2011/001 .. 2011/012 so that we get all 12 columns instead of just half the year. This is very important as we need the start Page Designer will the maximum possible number of columns which we can then add conditionally hide logic to remove columns that are out of the filter range.
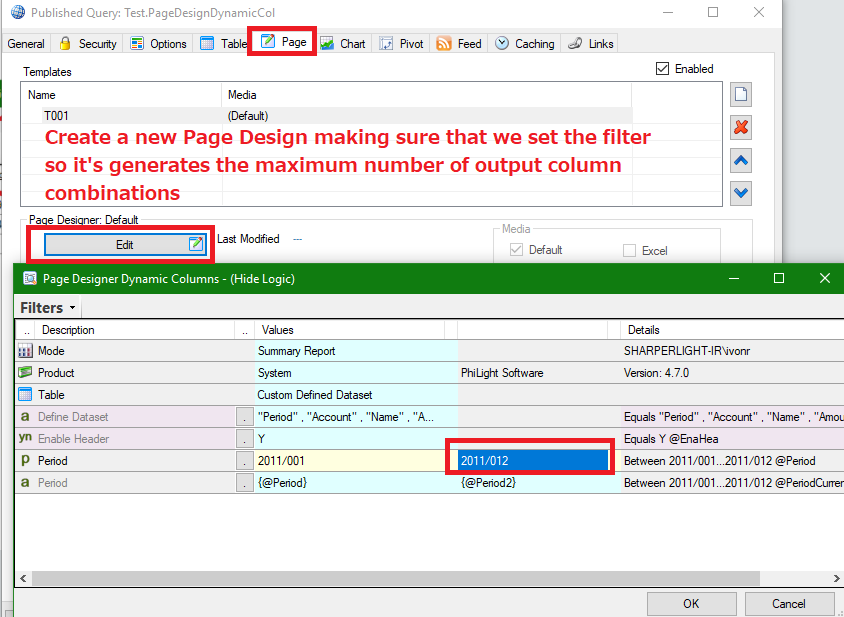
Start the Page Design with filter values that generate the maximum number of Dynamic Columns
Add an Expression to the Columns Hidden Property to hide the column when no data is present
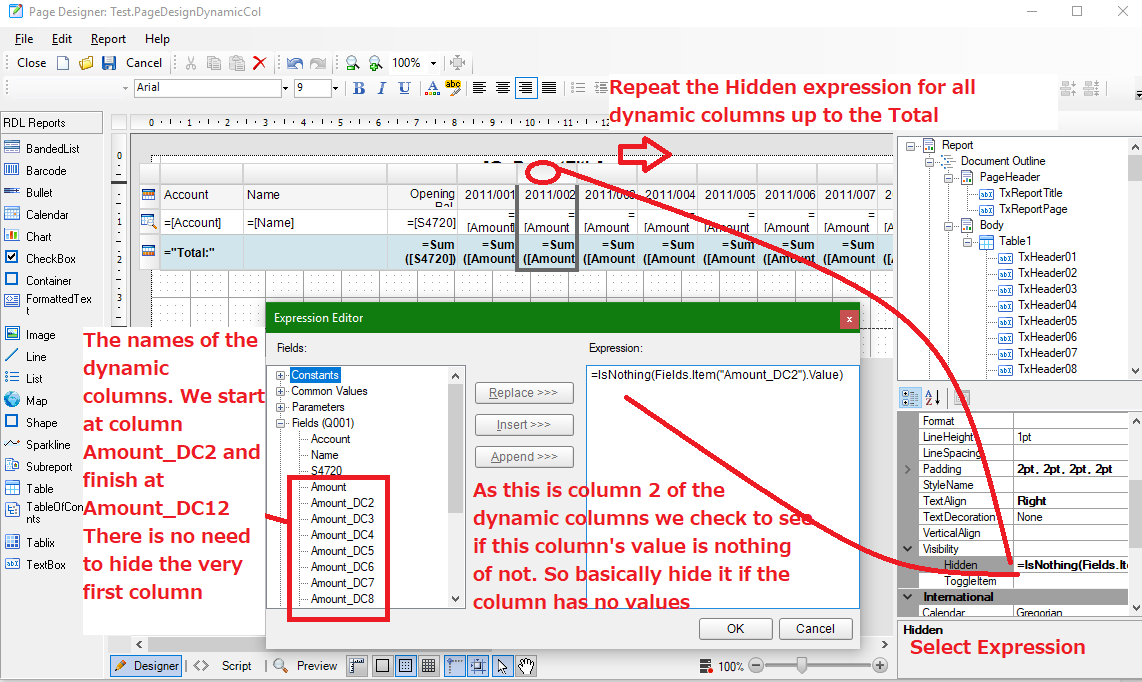
Select the second column in the dynamic range by clicking the column top section in the Table. Next expand the Visibility property section to reveal the Hidden property. Change the Hidden Property from False to <Expression> and then enter using the IsNothing() function on the Dynamic Output field name. For example =IsNothing(Fields.Item(“Amount_DC2”).Value)
We don’t need to apply hidden logic to the first columns only from the second column up to the last column (Period 12) of the dynamic columns. Basically what the expression is doing is checking to see if this column’s value is nothing of not and when it is nothing it hides the whole column.
Notice the dynamic columns field names are suffixed with _DC2 and continue counting up to the last column. In this example the last column’s field name is Amount_DC12
Repeat the expression logic on all the dynamic columns from the second column Amount_DC2 up to the last Amount_DC12
Enter a smaller filter range and preview the report to test the hide column logic.
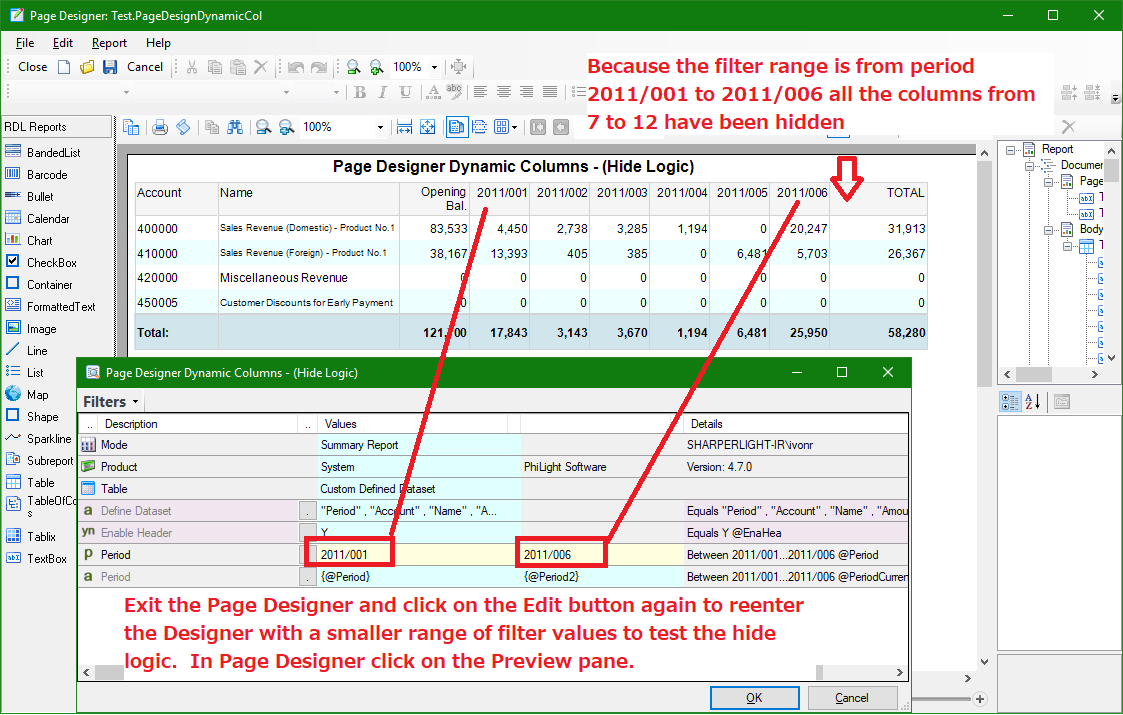
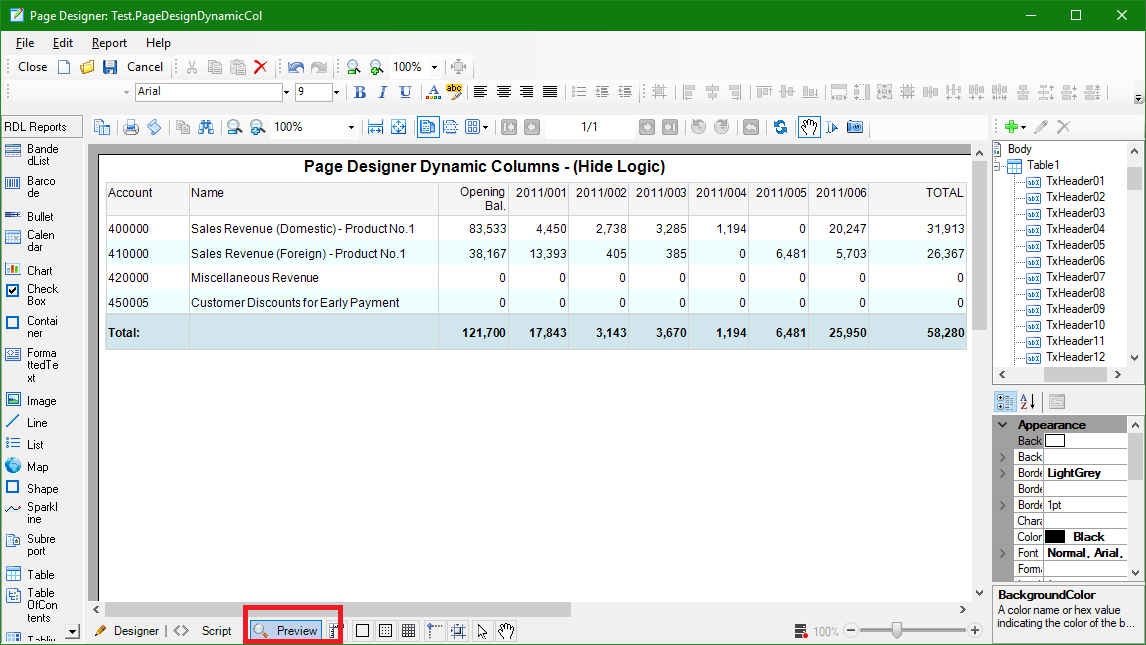
Close the Page Designer and click on the Edit button again to reenter the Designer with a smaller range of filter values to test the hide logic. For example set the Filter range back to period 2011/001 to 2011/006. In Page Designer click on the Preview pane.
Because the filter range is from period 2011/001 to 2011/006 all the columns from 7 to 12 should now be hidden
Adjust the Dynamic Column Labels to so they are dynamic and match the Filters values
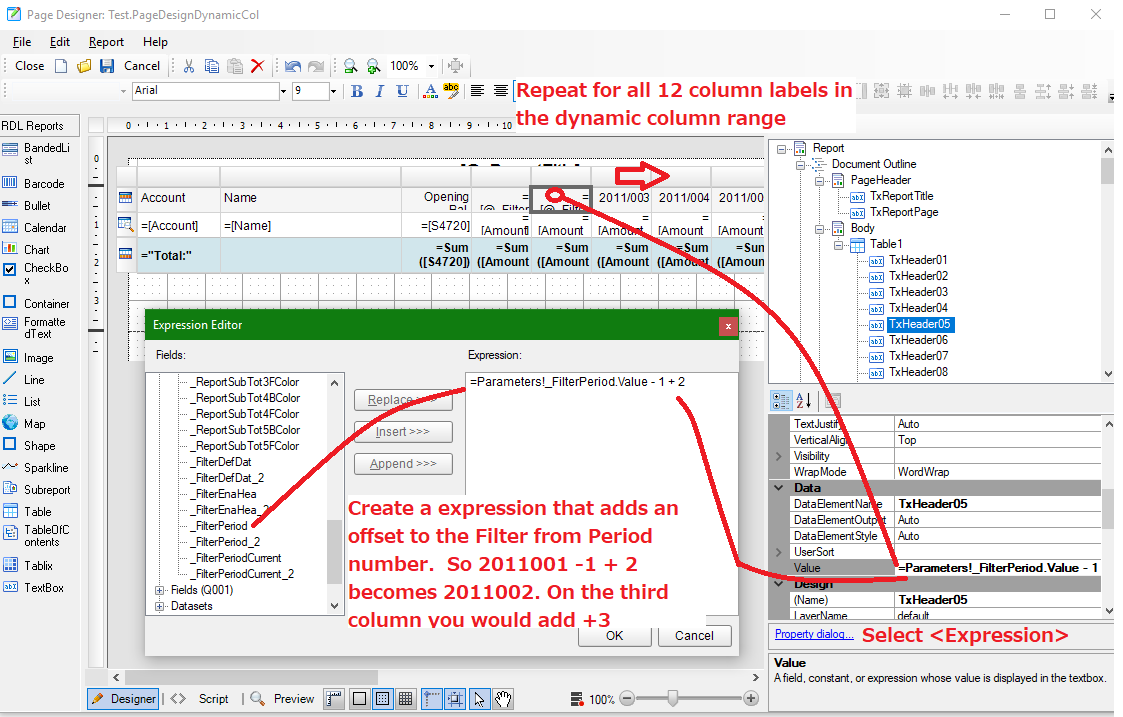
Create an expression that adds an offset to the Filter from Period number. If the label were to be left static then the following year they would not match the filter range values entered. So if the from Period was 2011/001 we would subtract 1 and add 2 for the seconds label and add 3 for the third label etc. For example 2011001 -1 + 2 becomes 2011002. On the third column you would add +3. The filter parameter can be found under Parameters .
First Column Label
=Parameters!_FilterPeriod.Value – 1 + 1
Second Column Label
=Parameters!_FilterPeriod.Value – 1 + 2
The next step would be to use the format property to format the period so with a slash. Repeat for all 12 column labels
Format the Period Label so the Year and Period/Month have a slash between them
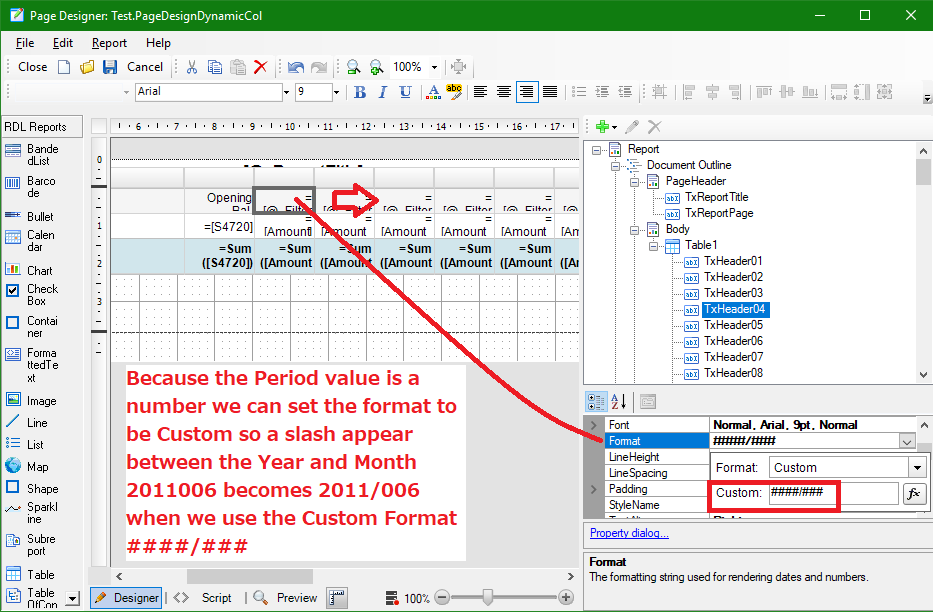
Because the raw Period value is a number we can set the format to be Custom so a slash appears between the Year and Month 2011006 becomes 2011/006 when we use the Custom Format
####/###
Apply the format to all the labels in the Dynamic Column Range.
Preview Labels in Page Designer
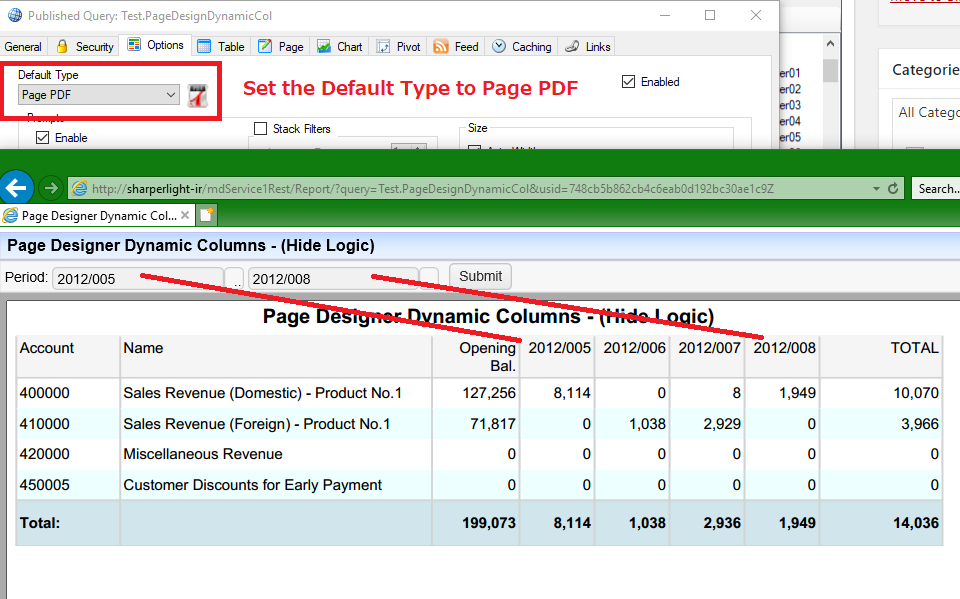
Set the Publisher Type to Page PDF and preview in the Web Channel