
Filter Panes
Filter Panes are a report type option available in a Published Report’s “Options” tab.
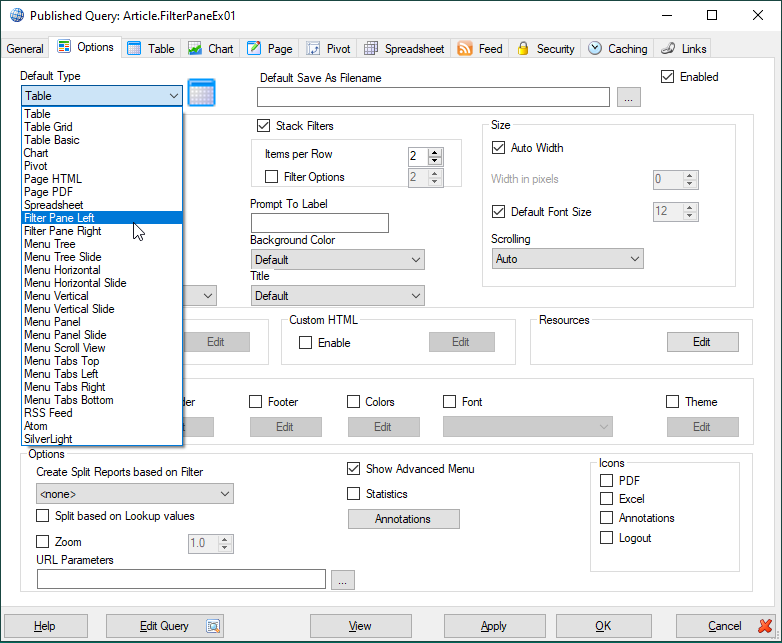
Filter Panes let the user interact with the filter prompts in a different way, similar to Power BI. Panes are present, and you can expand or collapse them and see available options to choose from.
We currently have options for the Filter Panes to appear on the right or left of the screen. First we’ll show a simple report with the default report type of “Table”:
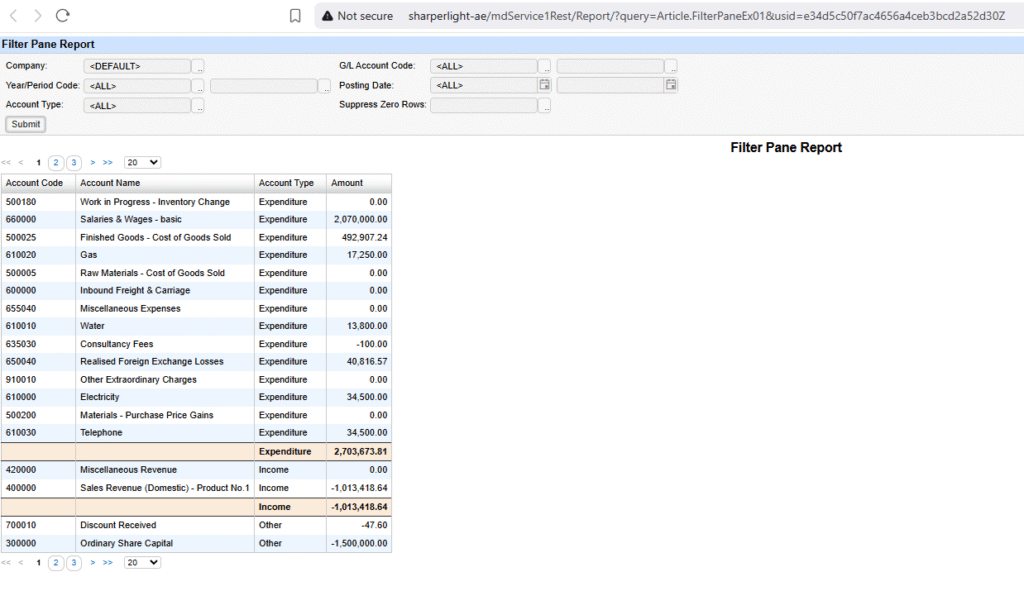
Now if we change this report to the report type “Filter Panes Left”:
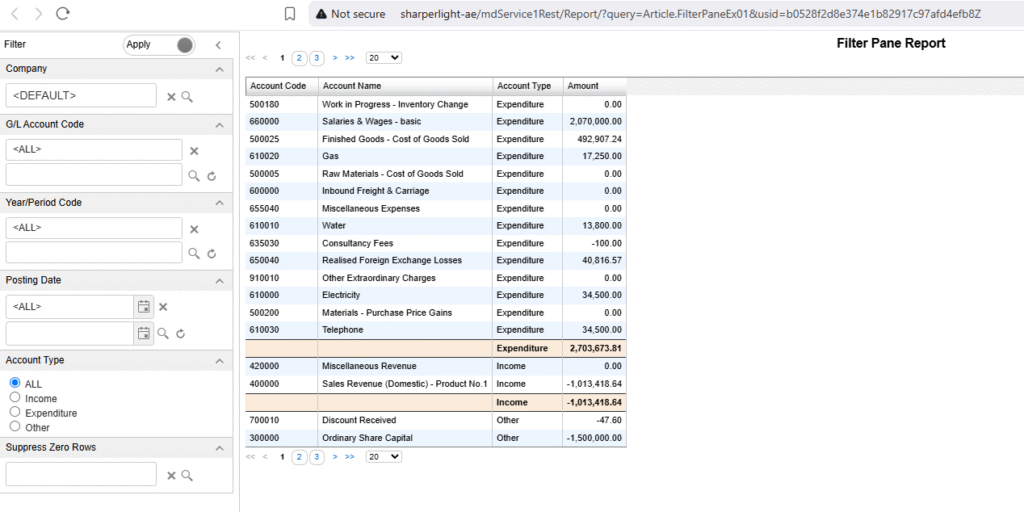
The filter prompts that typically appear on the top are now “Filter Panes” on the left side. Filter Panes Right does the same but places the panes on the right of the screen.
The screenshot above is the default behaviour and settings with no changes after setting it to “Filter Panes Left”.
You’ll notice all the Filter Panes are expanded, but if you have too many filters to show they will start collapsed.
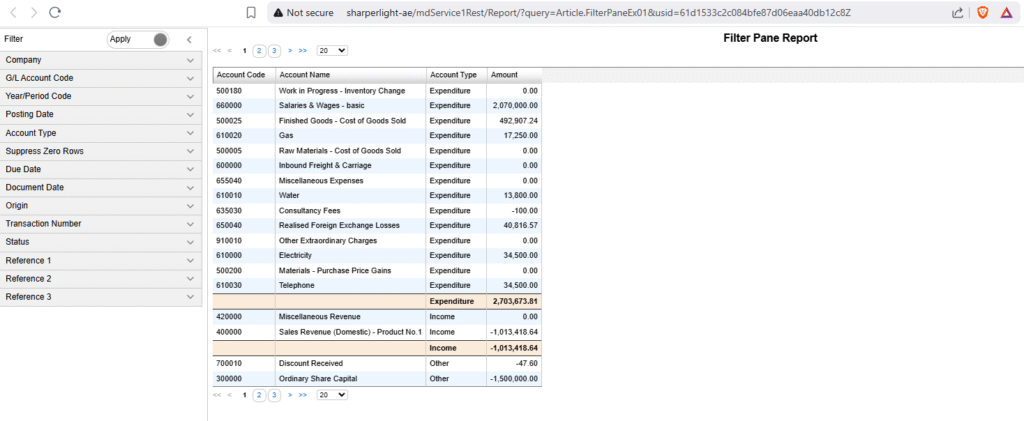
Sharperlight does make some changes based on what might be an expected or best behaviour when no changes are made to the settings.
For now let’s continue to make note of some key properties of Filter Panes.
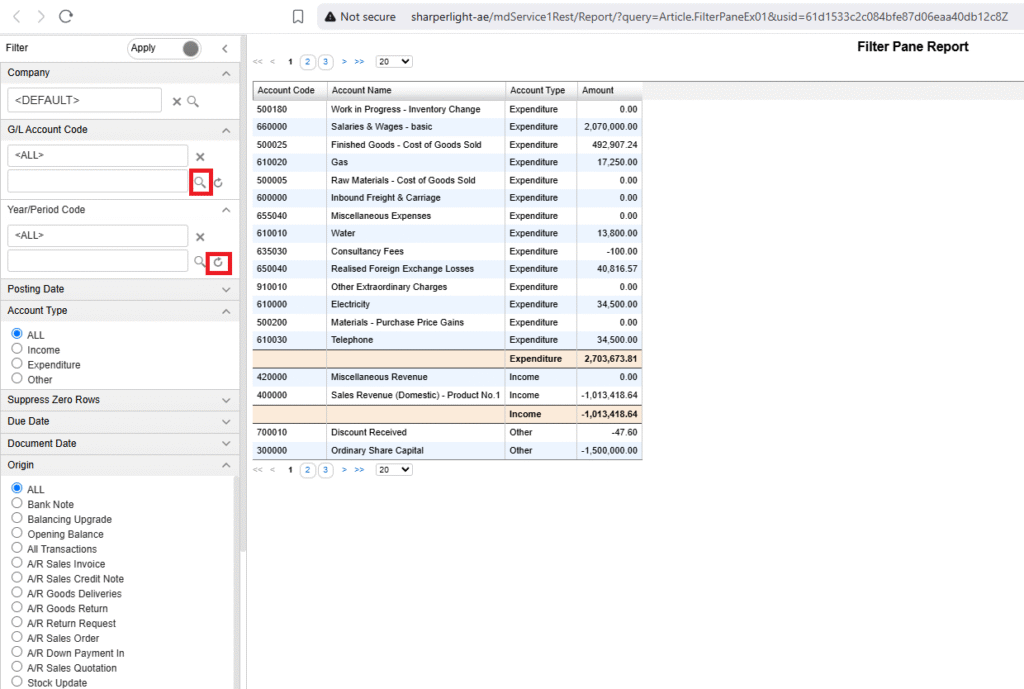
Based on the data type or settings, the panes will show a different selection option. In our screenshot we can see a lookup selection for Company, a FROM/TO lookup for G/L Account Code and Year/Period Code, and a radio button selection for Account Type and Origin.
Highlighted in the red boxes are the lookup icon (magnifying glass) and the refresh icons.
If you click on the lookup icon, you should see a lookup appear for you to select from:
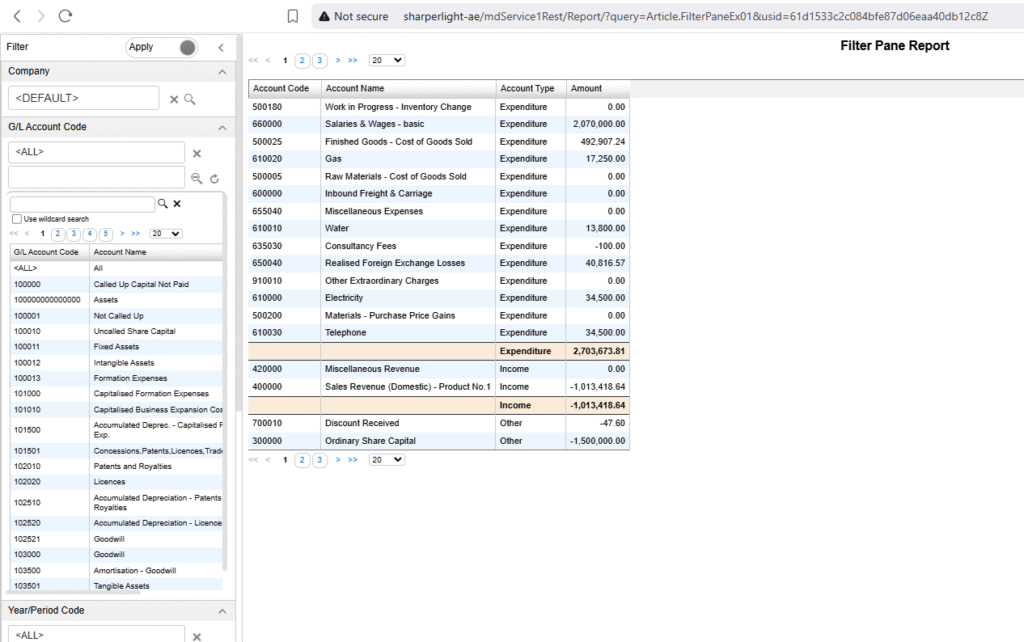
You can then select what you’d like from the lookup or manually input values for the FROM/TO section, then to apply click the refresh icon. For this example we’ll select a list of G/L Account Codes to filter on:
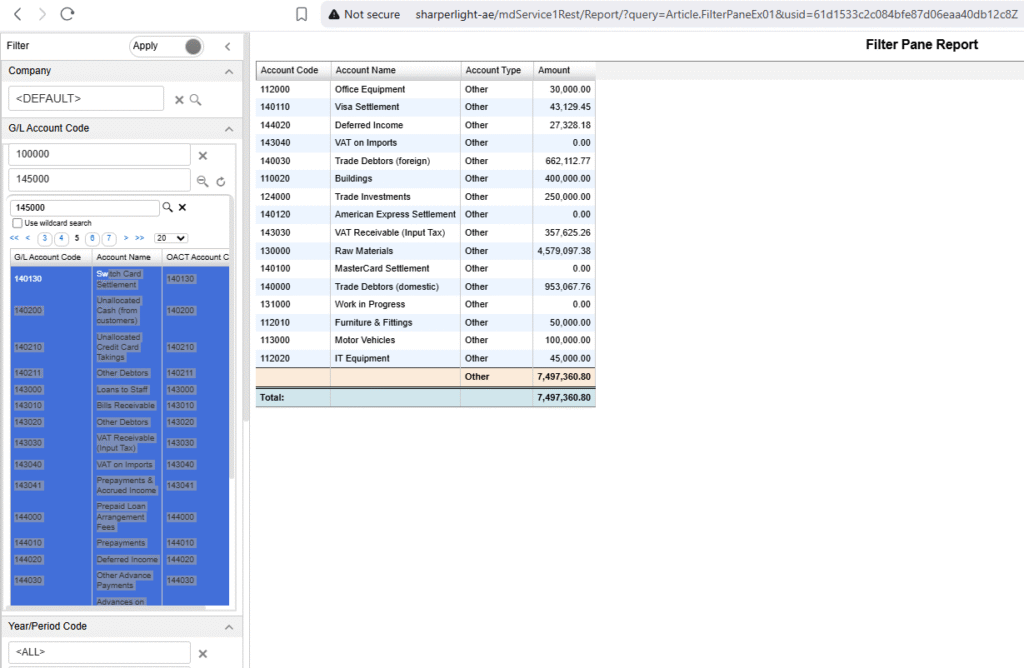
You can minimise the lookup by clicking on the lookup icon again.
Now most filter panes actually apply the filters and will refresh the output of the report when selected, but the FROM/TO types do not, thus they need a refresh button.
We’ll show this by now clicking on any option on the radio button for a filter, and you should see the report auto refreshes:
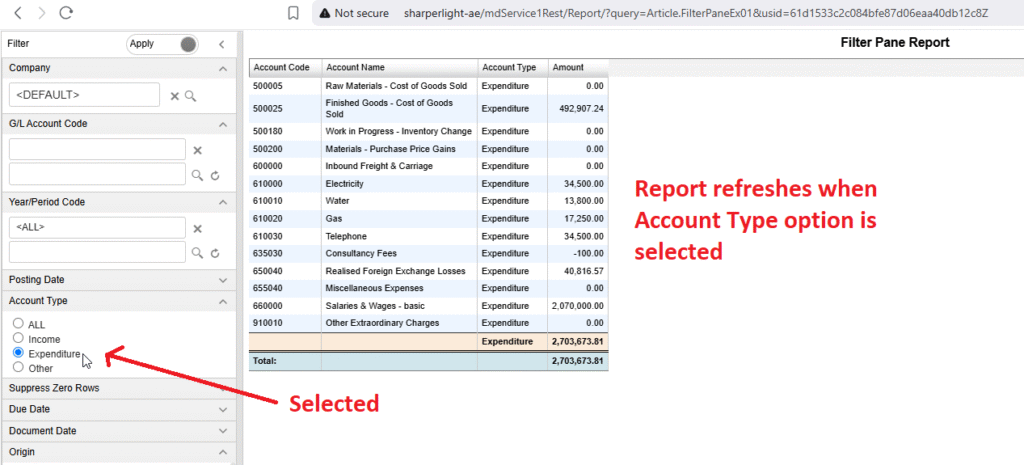
The same is true for lookups without a refresh button. For example if I select a company from the Company lookup, the report refreshes whenever I make a new selection:
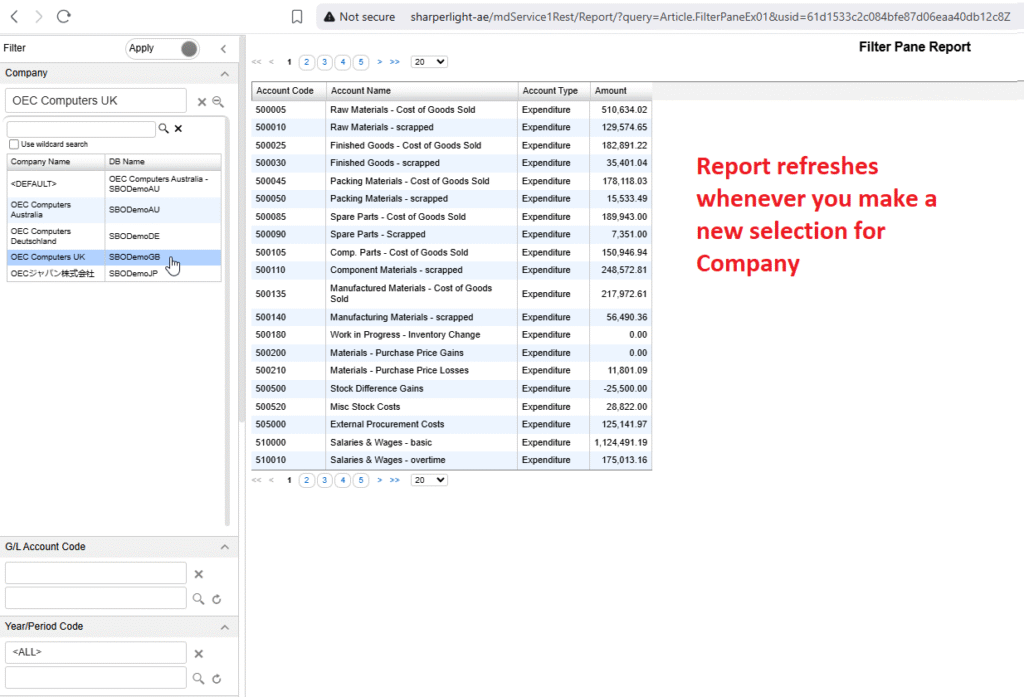
The behaviour of automatically refreshing the report on any selection is the default, but if you want to disable it, toggle the option at the very top for “Filter Apply”:
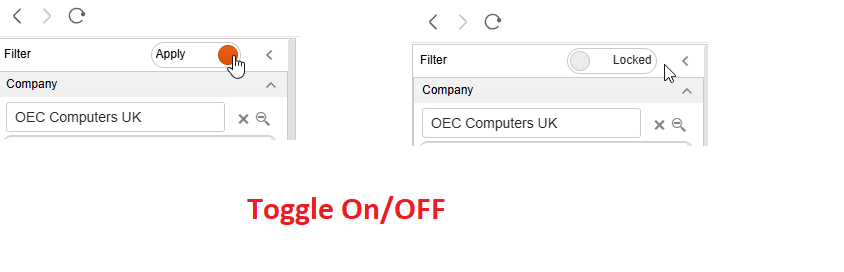
When the option is “Locked”, you can make all the selections without the report automatically recalculating. When you are done, simply toggle it back to “Apply” and the report will refresh.
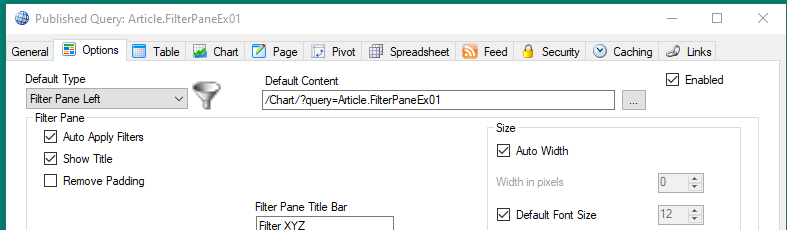
When you choose a Filter Pane for the report type, the Publisher “Options” tab does change showing you some relevant options for Filter Panes:
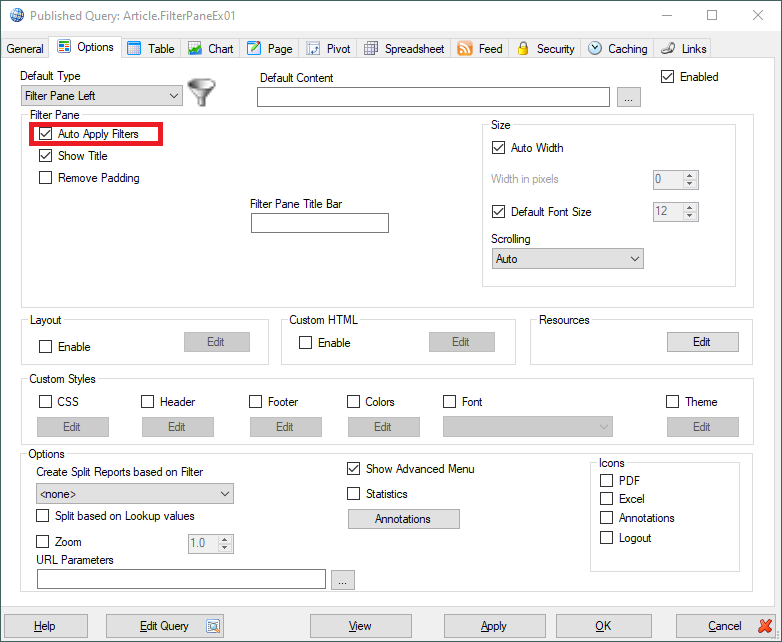
You can see highlighted in red is the option to set the default behaviour to have the Filters to be on “Apply” or “Locked”.
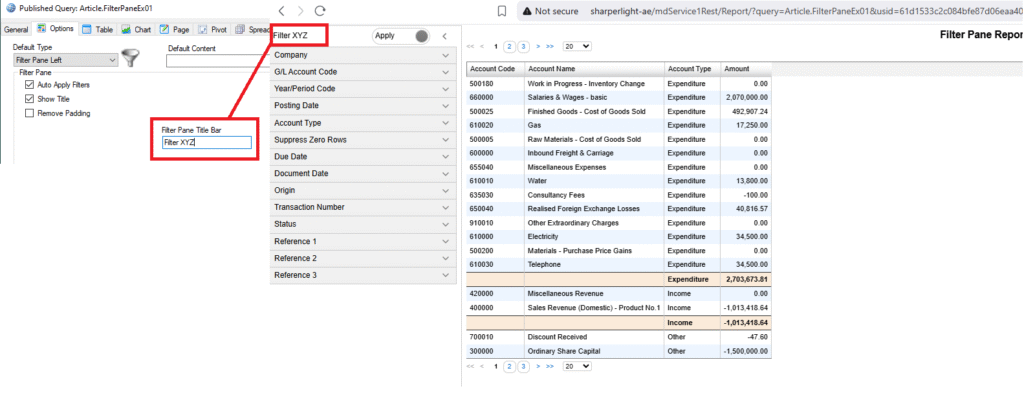
The “Filter Pane Title Bar” just lets you determine what goes for the description for the Apply/Locked toggle option:
The Default Content section is bit more interesting, as what typically happens when this is blank is the Filter Panes report simply outputs a table of what the query in the Published Report is.
So for this example I have a query against the G/L Transactions table for my SAPB1 Datamodel.
You can however make it apply the filters to a different report, or even output as a different report type (e.g. a chart).
Please keep in mind that if you do use a different report, you have to have matching filter code/names to help Sharperlight pass through the filter parameters.
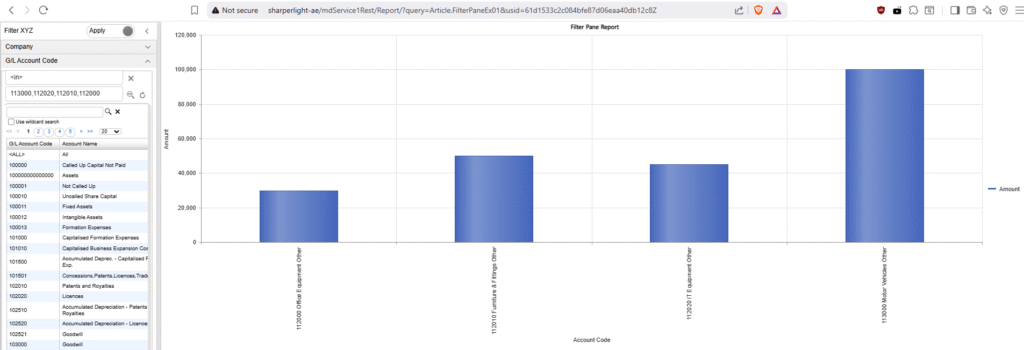
For now let’s show us setting the “Default Content” to the same report, but as a chart.
Now when the report refreshes we see it load the “Default Content” which is actually a link to the report again but now with the URL set to have the report type to “/Chart/” instead of “/Report/”.
The next important option to be able to change is what type of option will each pane be. For instance if we wanted to allow for multiple Account Types, the radio option has to change as it only allows for a single choice.
These options are actually determined in the report query itself, in the Filter Options for each filter.
Let’s find the filter for Account Type and see what we can change:
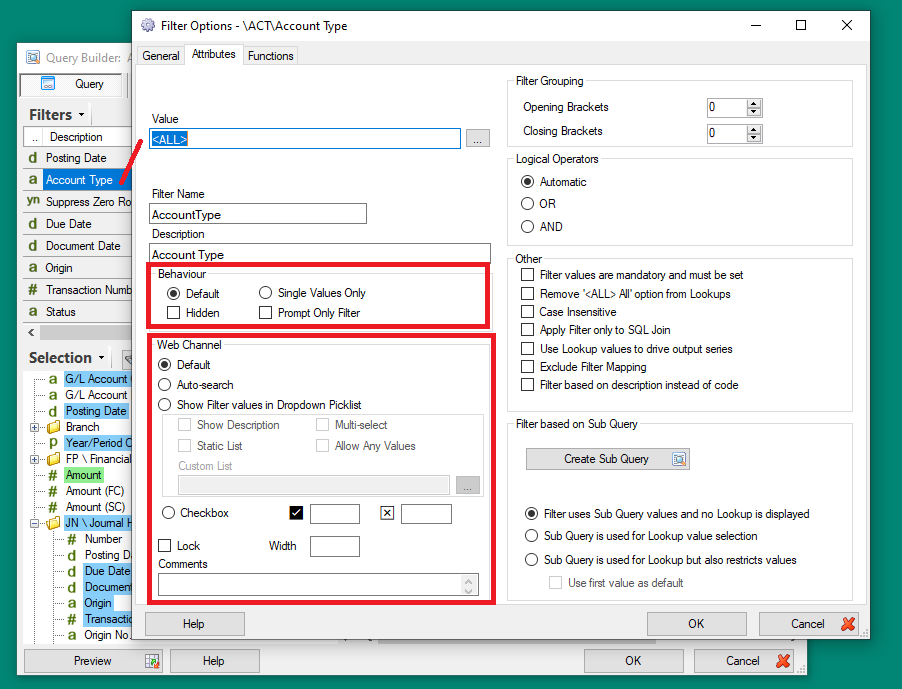
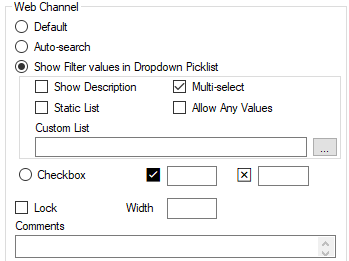
Now if we want to change Account Type to allow for multiple choices, in the “Web Channel” section let’s select the radio option for “Show Filter values in Dropdown Picklist” and then tick the box for “Multi-Select”.
To make this easier to follow, the report has been changed back to no longer have something in the “Default Content” section so we should see the report return as a table report again.
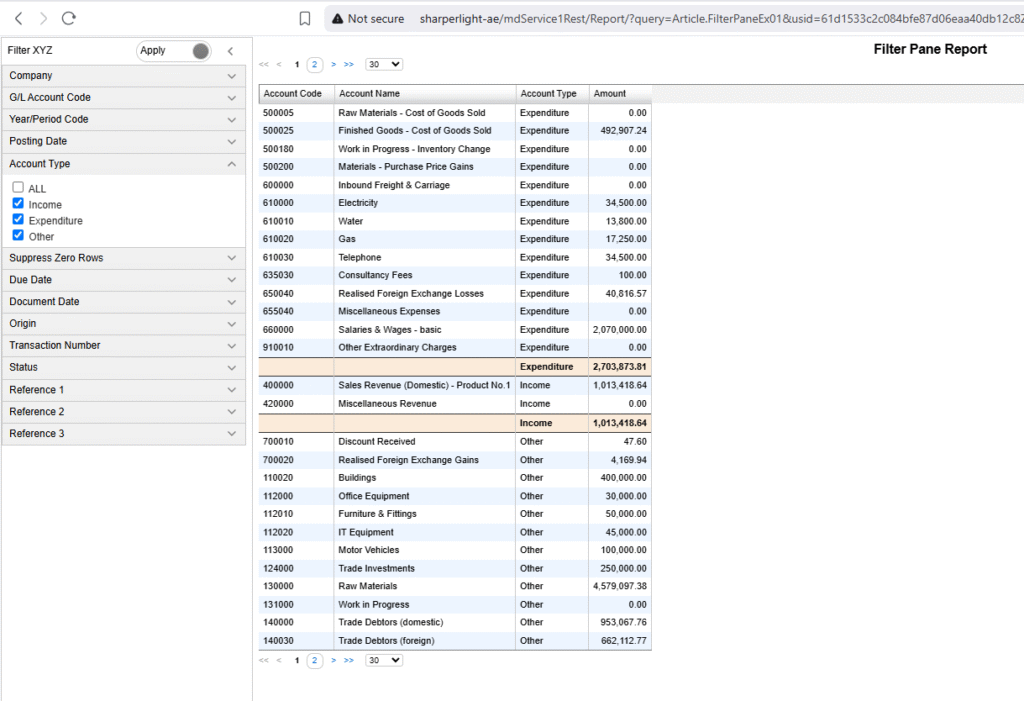
You can see we can now select multiple options for Account Type.
This however is still manipulating what the default behaviour will do, we can be more specific.
If you go back to the Filter Options but now look at the “Functions” tab, we will have some options just for Filter Panes:
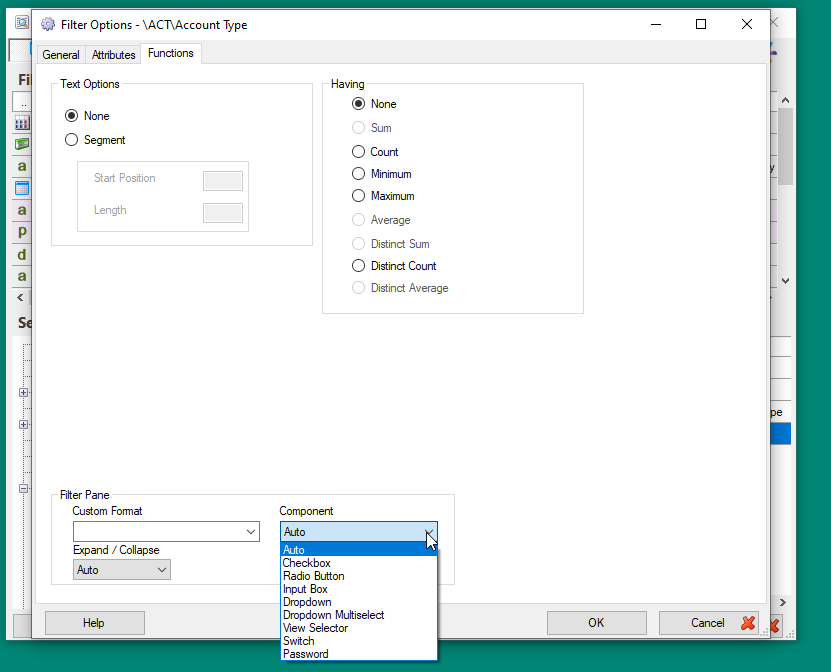
Here you can change the format, set the default for Expand/Collapse and what type of option you’d like for each Filter Pane.
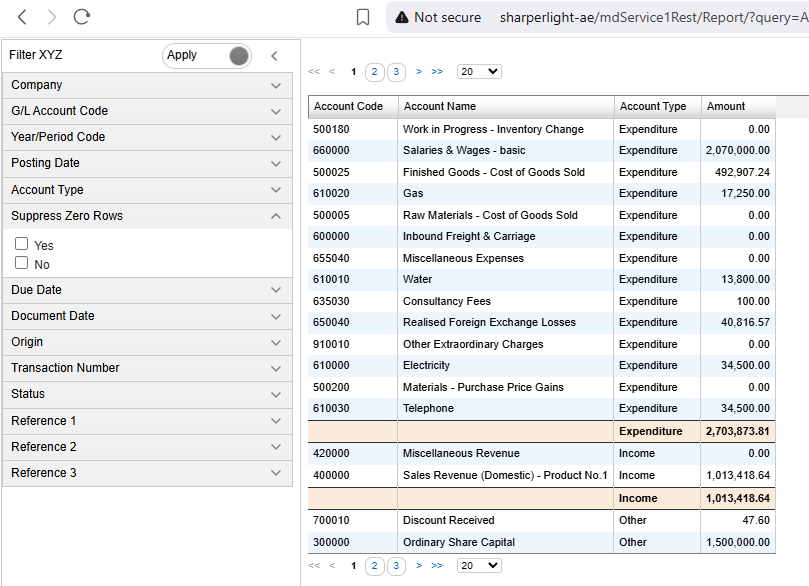
If we look we might find a Filter Pane that doesn’t look appropriate, for example “Suppress Zero Rows”:
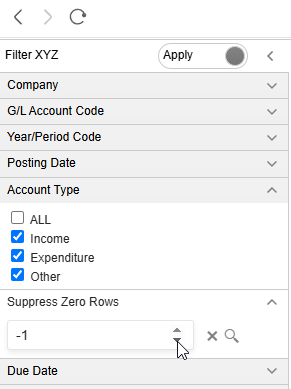
It shows as a lookup box with the up/down arrows to allow for adding/subtracting 1.
Let’s set it to auto expand and be a selection:
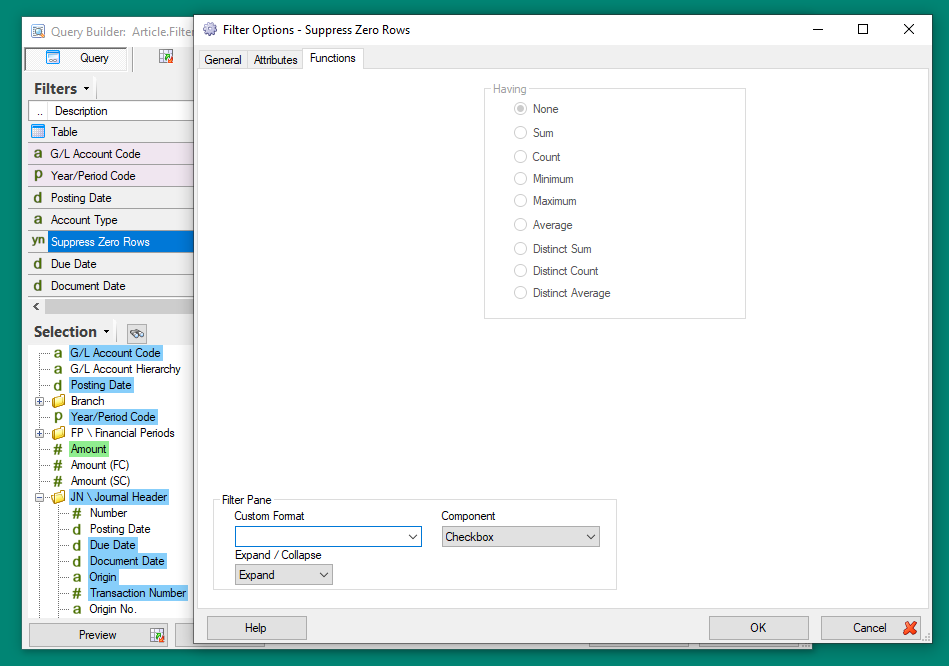
Now when we load our report:
There are some more advanced options to note of but will be covered in another post:
– ability to change the Filter Pane colour using html
– theme apply colour to the report (colour the Filter Panes)
– can link to other reports using “Default Content” and matching Filter Codes
– slices
-on intial load screen (to help with what to display on intial load if the Apply/Locked is set to Locked by default)