
Prompt-linked multiple reports
Introduction
This post shows you how to create a dashboard style of report and a common prompt drives the multiple reports in a page.
Practices
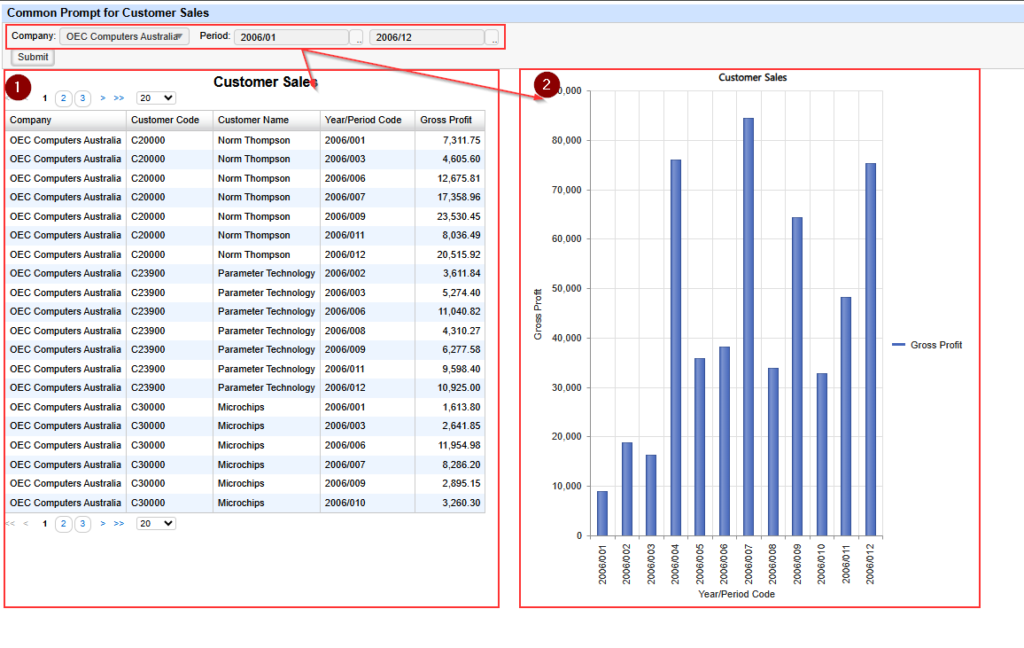
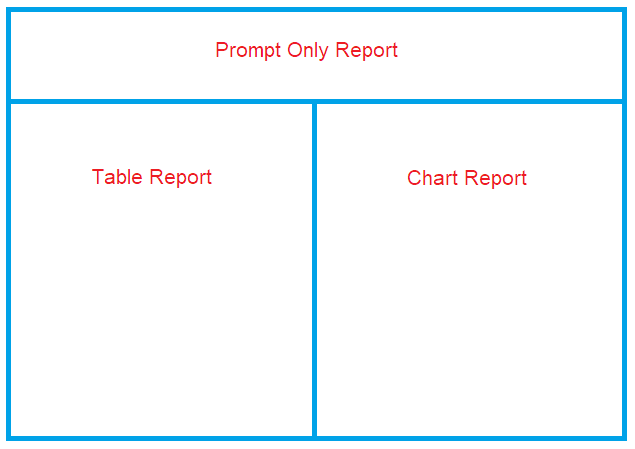
We will create this type of report shown below.
The prompt (Company and Period) entered will be passed to the table style of report(1) and the chart style of report(2).
Therefore, we will create three reports, a Prompt only report, a Table and a Chart, and we will use the “Layout” option.
The key to making this work is that all three reports must have the same filters, and the filter names must match exactly. In this example, they all need to include “Company” and “Period” filters, and the filter names must be identical across the reports.
Let’s start building it. In this example, we’ll use SAP Business One as the product.
Prompt Only Report
This allows users to enter filter values, which are passed to the linked reports as soon as the Submit button is clicked.
This query requires only the prompt section, and the query result is not important. For this reason, we choose the “Companies” table this time.
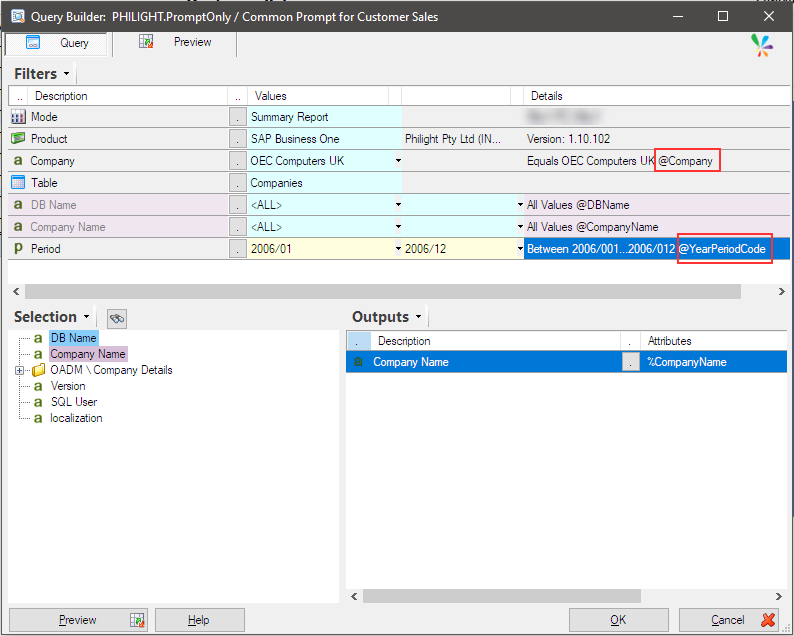
The “Company” filter is automatically displayed, regardless of which table is selected for SUP Business One.
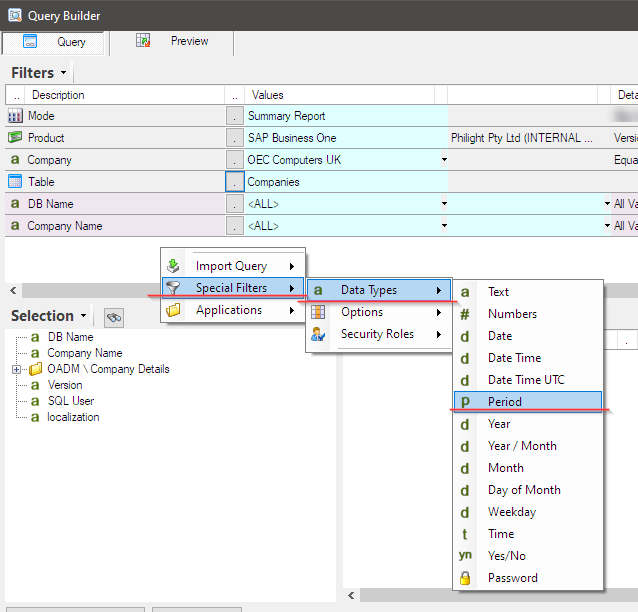
The “Period” filter must be added as a special filter, since it does not exist in the “Companies” table.
The special filter can be added with the next steps.
“Right-click” in the filter definition pane to show the drop-down menu, navigate through “Special Filters” -> “Data Types” -> “Period”.
The output does not mean that only the prompt/report is required, a query must also be included so that the “Company Name” can be selected.
Finally, we must ensure that the filter names for “Company” and “Period” are correctly defined and match exactly across all reports. These filter names are the key to the linked reports configuration and are used in the linked reports.
- @Company
- @YearPeriodCode
Table Report
We create a report that displays sales information in a table.
The “Sales A/R” table is selected, and the Year/Period Code field is automatically set as a mandatory filter.
The outputs are set as shown below.
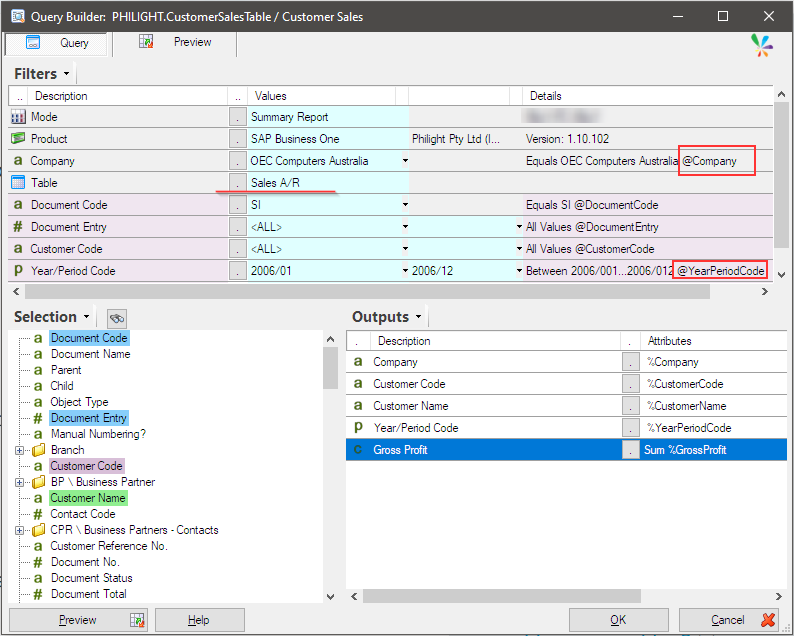
Finally, ensure that the “Company” filter name and “Year/Period Code” filter name are exactly the same as the one used in the prompt-only report.
- @Company
- @YearPeriodCode
Chart Report
We create another report which shows sales figure in a column chart.
The “Sales A/R” table is selected, and the Year/Period Code field is automatically set as a mandatory filter.
The outputs are set as shown below.
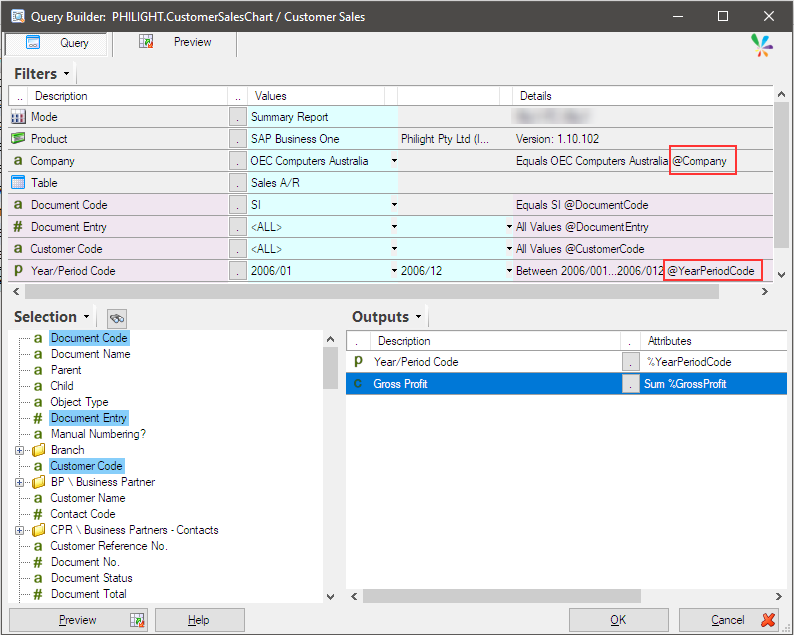
Finally, ensure that the “Company” filter name and “Year/Period Code” filter name are exactly the same as the one used in the prompt-only report.
- @Company
- @YearPeriodCode
Layout option
Those three queries have now been prepared. Let’s move to the final step: combining these three reports to create a single unified report.
We use the “Prompt Only Report” is the host of the “Layout” option, and define the following layout design.
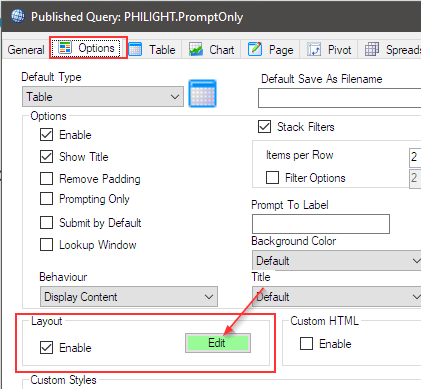
Open the “Prompt Only Report” that was created at the beginning. Then go to the “Options” tab.
Enable the “Layout” option, then click the “Edit” button.
Layout editor opens and click “New” icon.
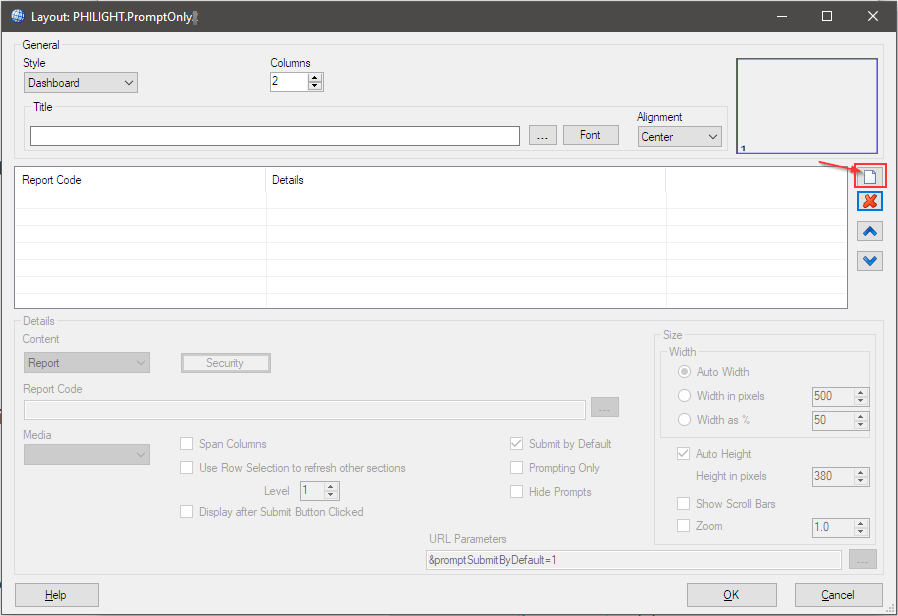
The first entry is added. It must be “Prompt Only Report” and the three parts of the options must be set.
Set the “Columns” option to 2, as the table report and the chart report need to be displayed side by side (in parallel).
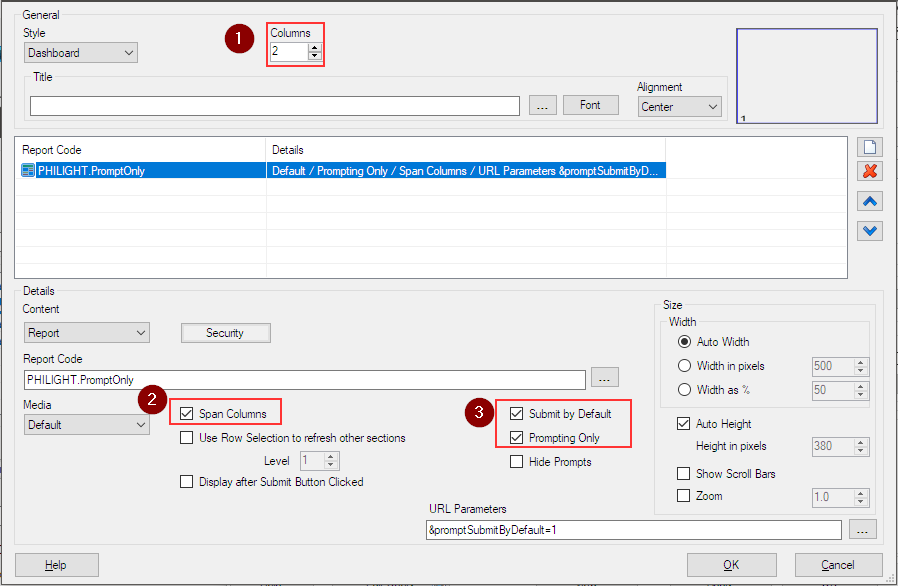
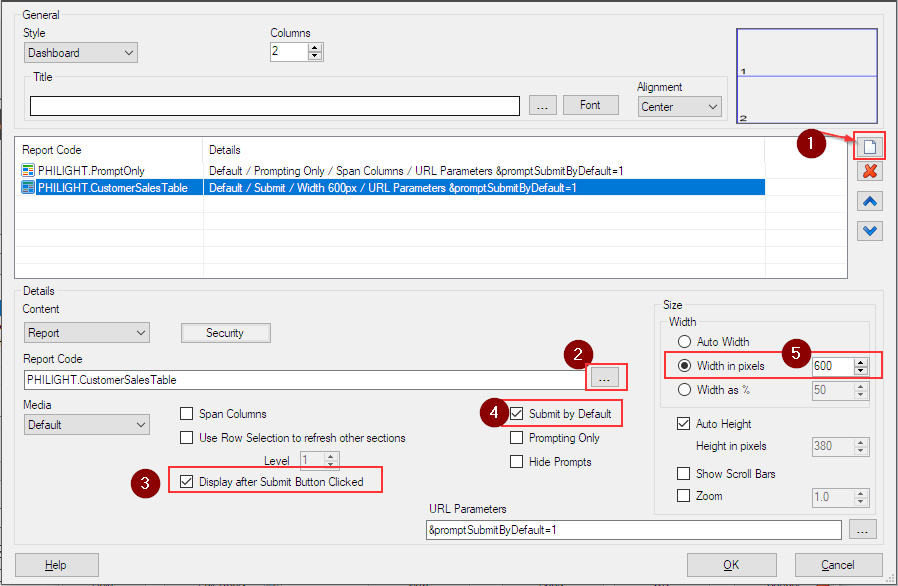
Click “New” icon to add the “Table Report” (1), and browse and select the table report by clicking the three dots button (2).
Then these options (3,4 and 5) must be set.
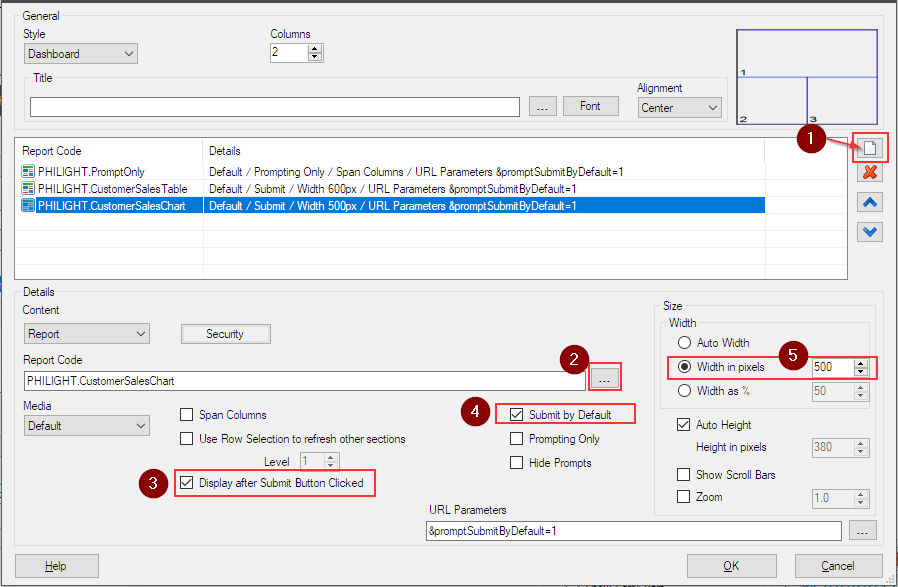
Click “New” icon to add the “Chart Report” (1), and browse and select the chart report by clicking the three dots button (2).
Then these options (3,4 and 5) must be set.
The layout settings are now complete.
Click “OK” to save the layout settings.
Click Apply to save the report definition. Then, after confirming that the Sharperlight service is running, click View.
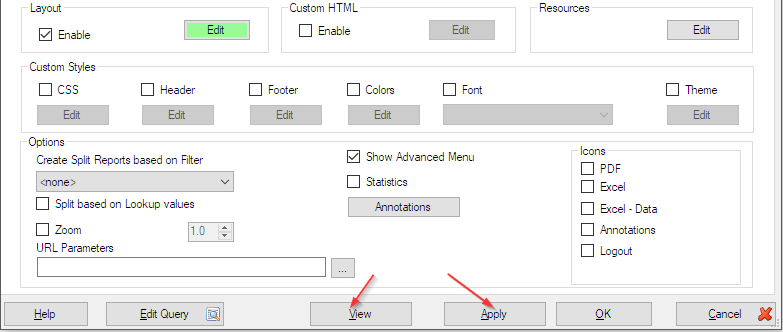
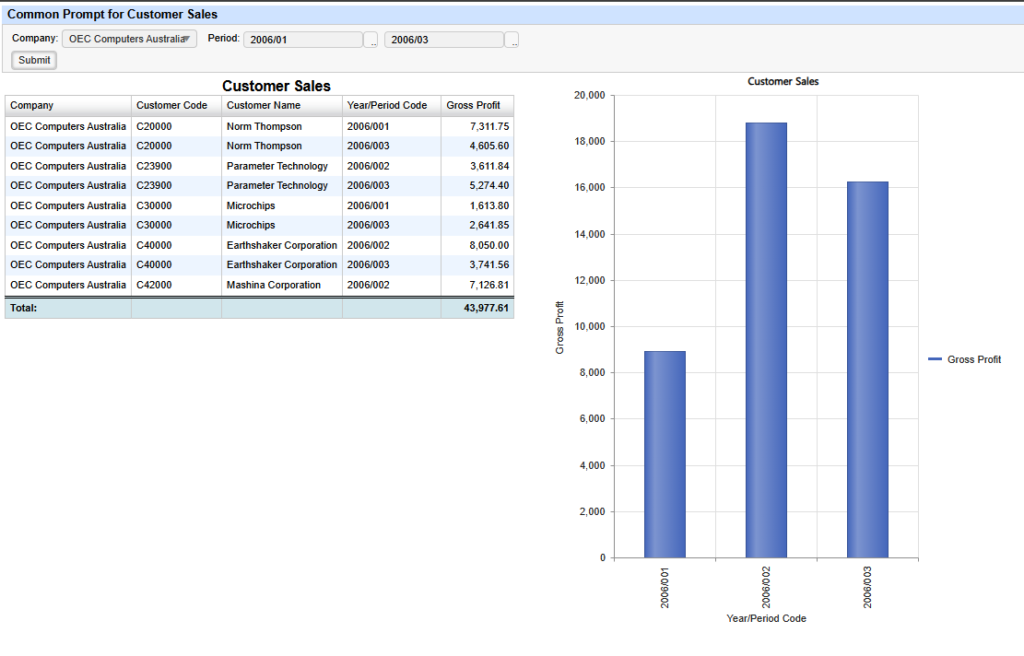
The report must look like this: the prompt only report is shown at the top and the table report and the chart report displayed side by side (in parallel / in two columns).
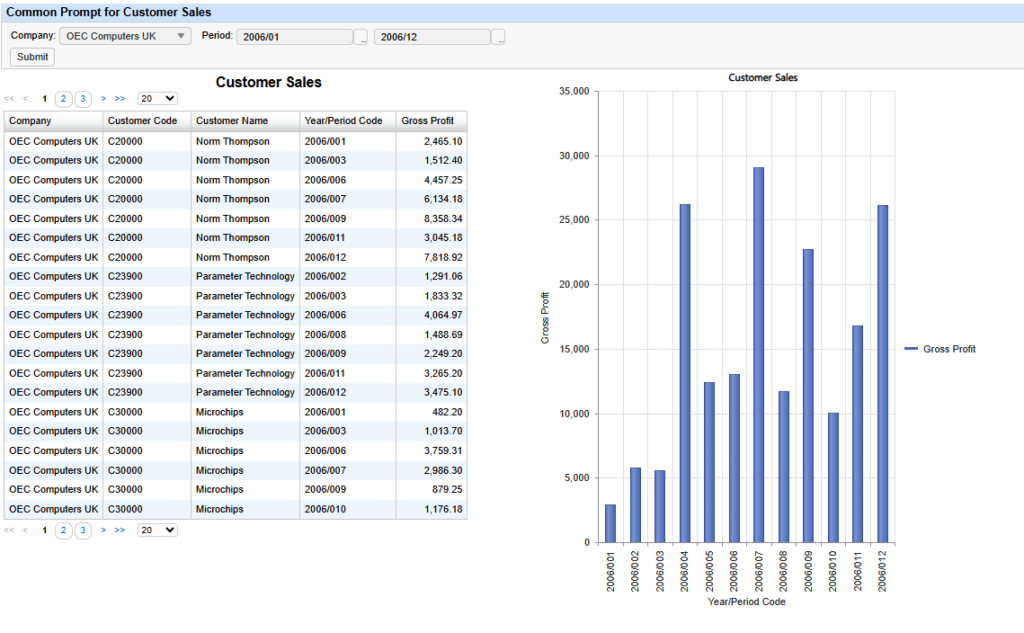
The filters current selections reflect to the both reports.
Afterword
Please remember that the key to this configuration is the filter names. These names determine which values are passed to all reports placed in the same layout.