
Page Designer – Table Basic
Introduction
In this post, you’ll learn how to create and define a table using the Page Designer.
Practices
There is a dataset includes information about items sold, along with their corresponding order numbers and customer names.
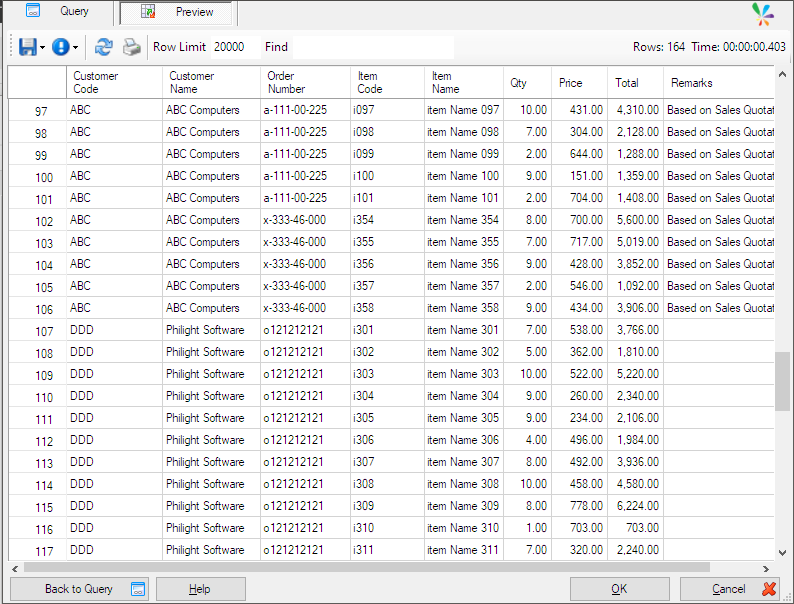
Let’s go for the Page Designer. (See the related post for more information: Page Designer – Query and Table)
Defining a table
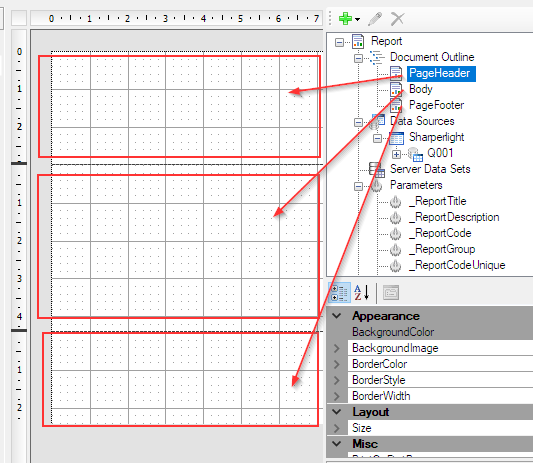
Remove all auto-generated elements from the designer.
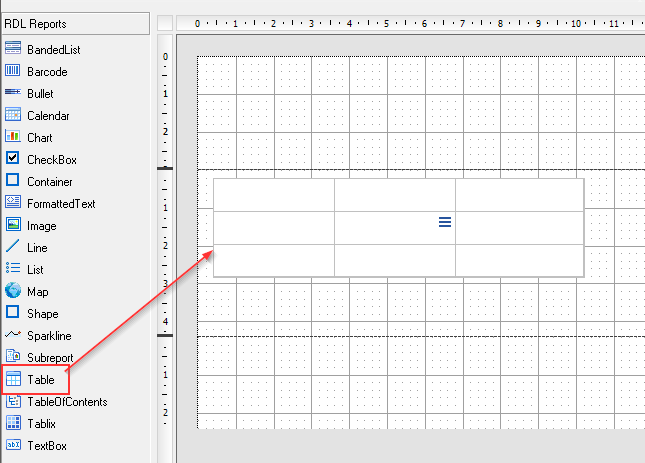
Add ‘Table’ element to the page body. As default, only 3 columns are presented.
Select the table to display the icons that indicate which rows are the table header, detail, and footer.
Select the three-line icon to view the list of output items available from the source query.
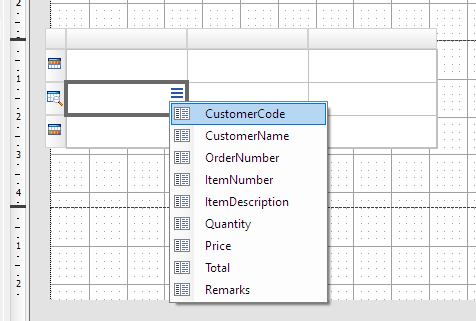
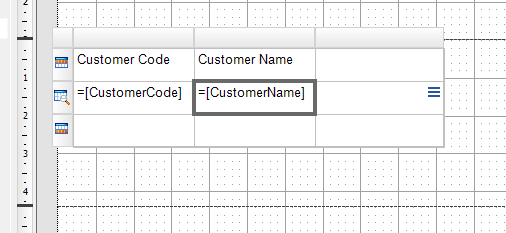
Select ‘CustomerCode‘ for the first cell in the ‘Body’ row, and ‘CustomerName‘ for the second cell, and so on. Add additional columns to the right as needed to include all output items.
Once you select an output item, its description appears in the matching cell in the ‘Table Header‘ row.
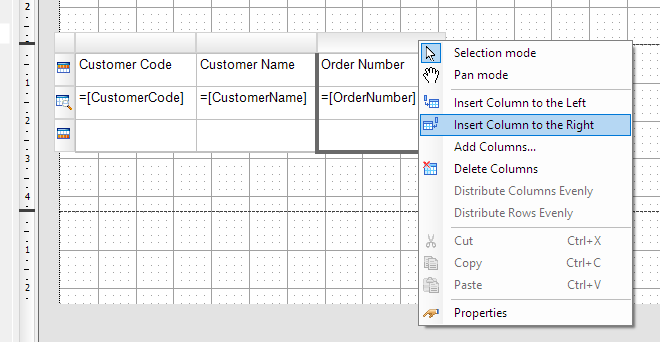
A new column can be added from right-click menu.
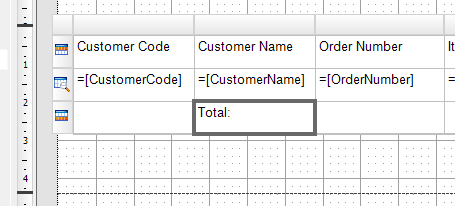
Once all output items have been added to the ‘Body‘ row, enter ‘Total: ‘ in the 2nd column of the ‘Table Footer‘ row.
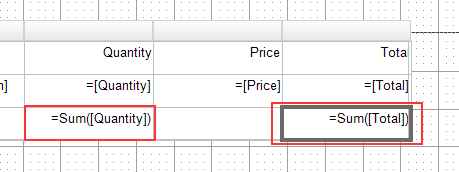
For the ‘Quantity‘ and ‘Total‘ cells in the ‘Table Footer‘ row, select their corresponding data items again using the right-click menu. They will be automatically set with the SUM function.
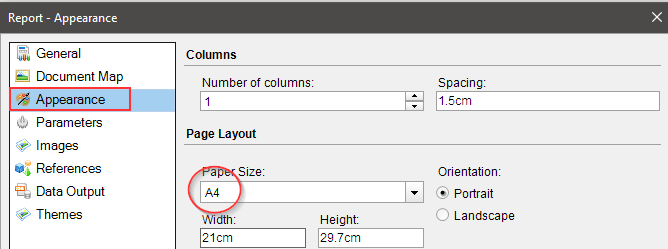
Configuring Paper Size and Layout
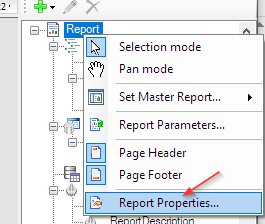
Go for ‘Report Properties’.
Select ‘A4’.
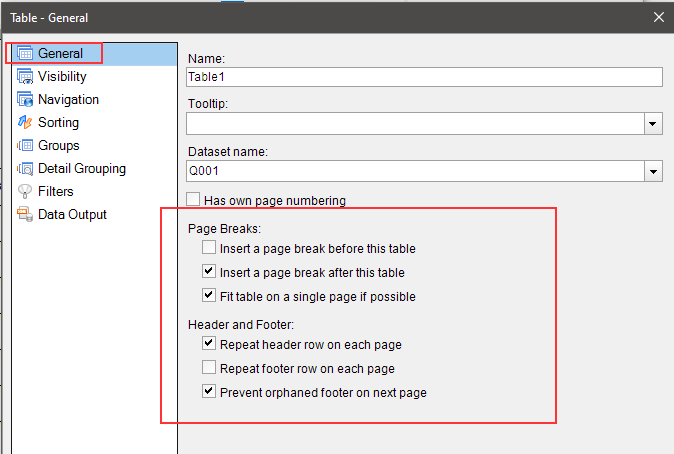
Choosing Page Breaks and Header/Footer Options
Open ‘Table Properties’ and select the following options.
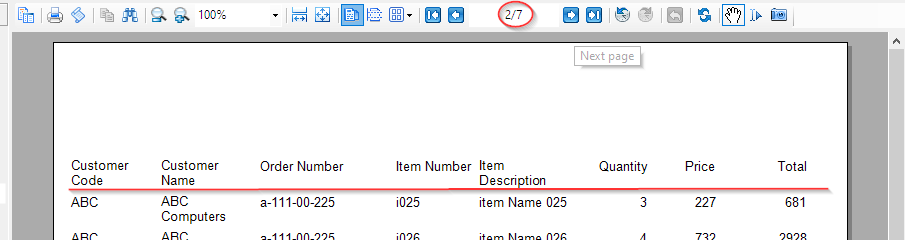
Adjust the column widths to fit the selected paper size, then preview the report to ensure proper alignment. The table header is displayed at the top of each page.
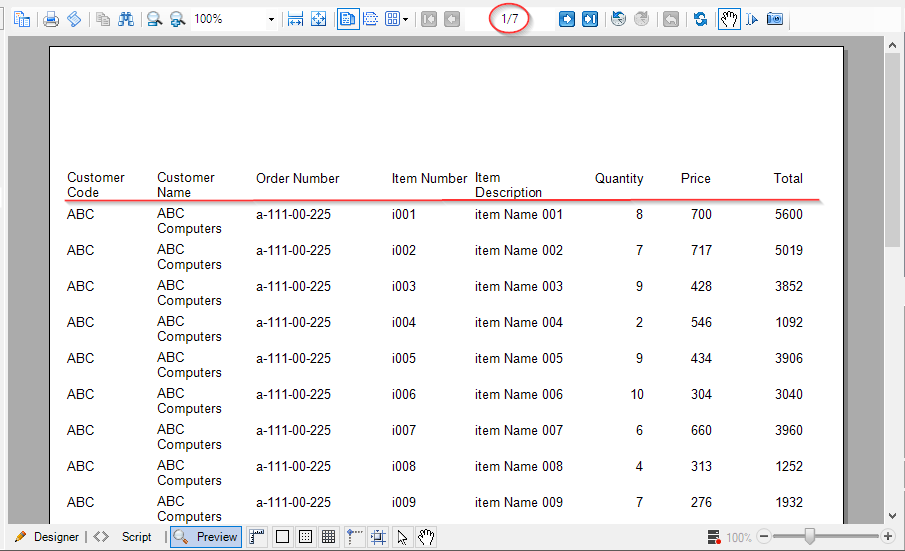
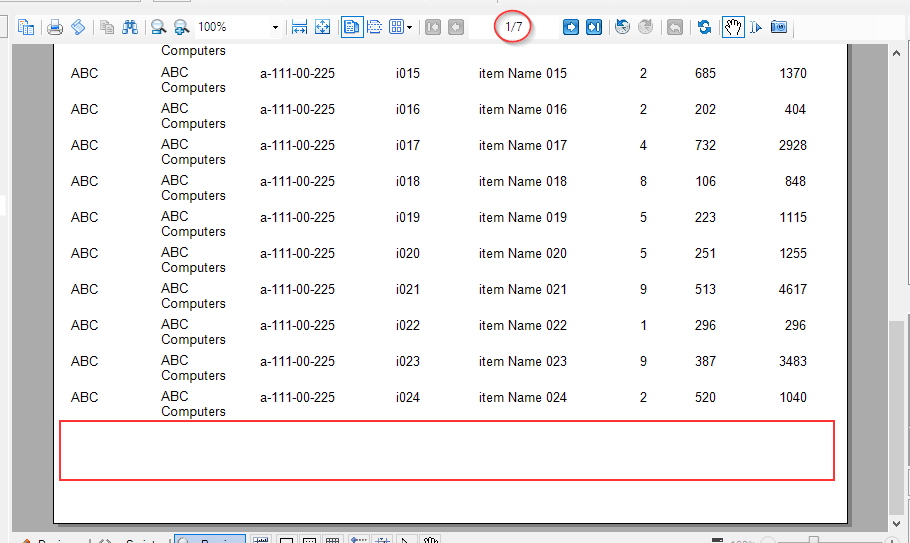
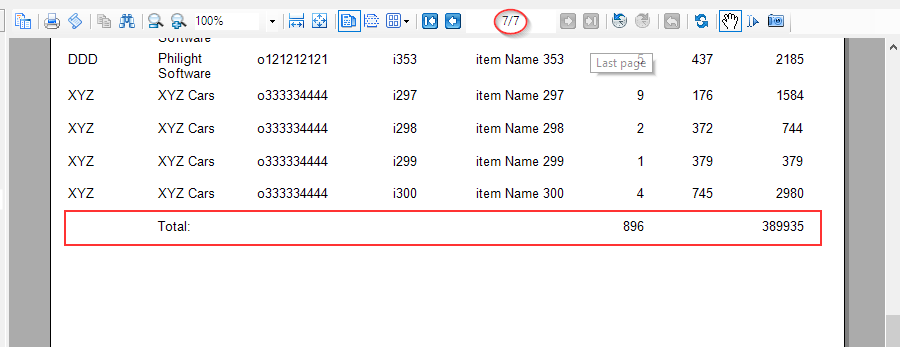
However, the ‘Page Footer’ is displayed only on the last page, as defined.
Dressing up the table
BackgroundClour for Header/Footer rows
Select the whole header row and change the background colour.
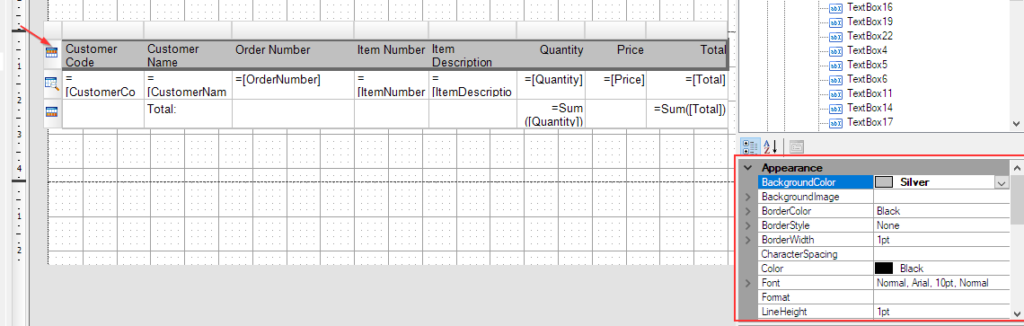
Next, configure the following settings:
- ‘Bold‘ for Font property
- ‘Centre‘ for Text Align property
- ‘Middle‘ for Vertical Align property
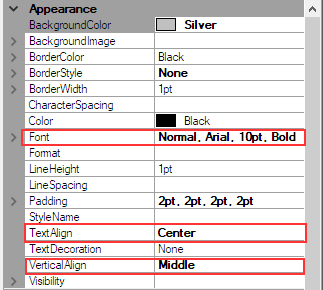
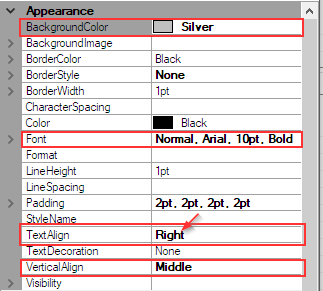
Apply similar settings to the table footer row as used in the header row. However, set ‘Right’ for its Text Align property.
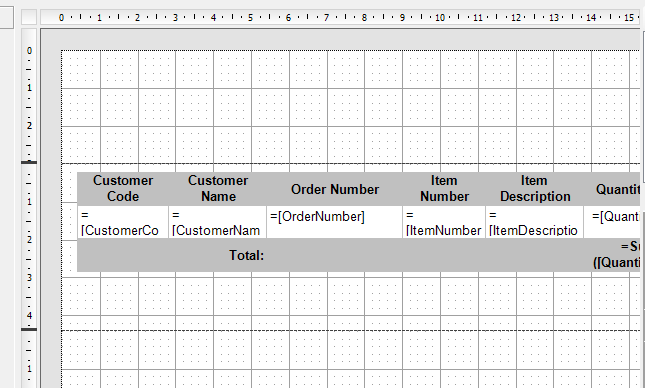
Not, its design view is like this:
Then, in preview, the header row is:
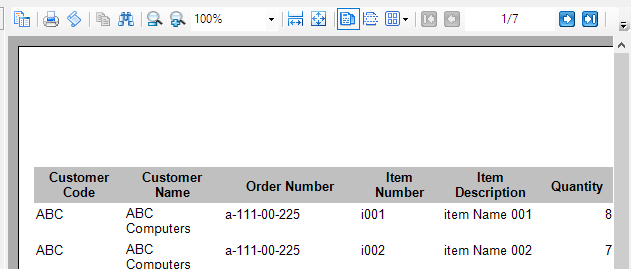
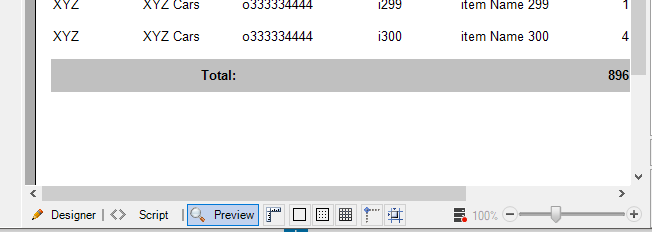
The footer row is:
Vertical lines of the columns
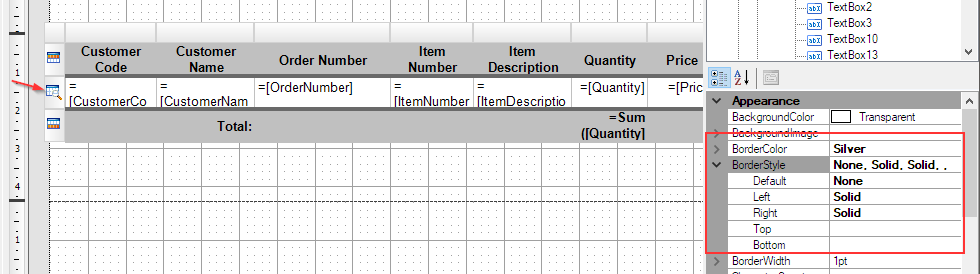
Add vertical lines to the columns. Select the whole detail row and configure the following properties:
- ‘Silver‘ for Border Colour property
- ‘Solid‘ for Border Style – Left property
- ‘Solid‘ for Border Style – Right property
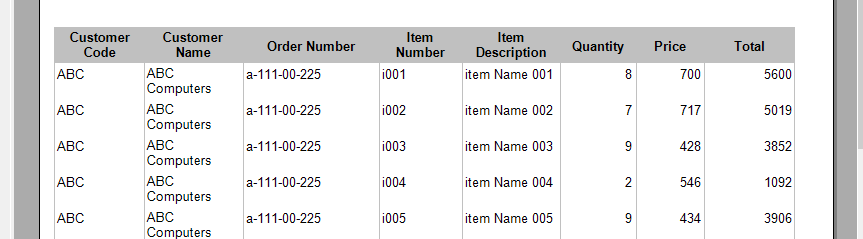
Now, the vertical border lines are visible in the preview.
BackgroundColour for the detail rows
Add a background color to the even rows by writing an expression in the ‘BackgroundColour’ property.
Select the whole detail row and display the dropdown list for its ‘BackgroundColour’ property, and select ‘<Expression>’ to open the expression editor.
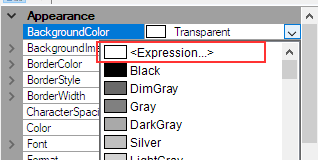
Add this expression to it with the expression editor, and click OK to save it.
=IIF((RowNumber() mod 2) =0, "Azure","Transparent")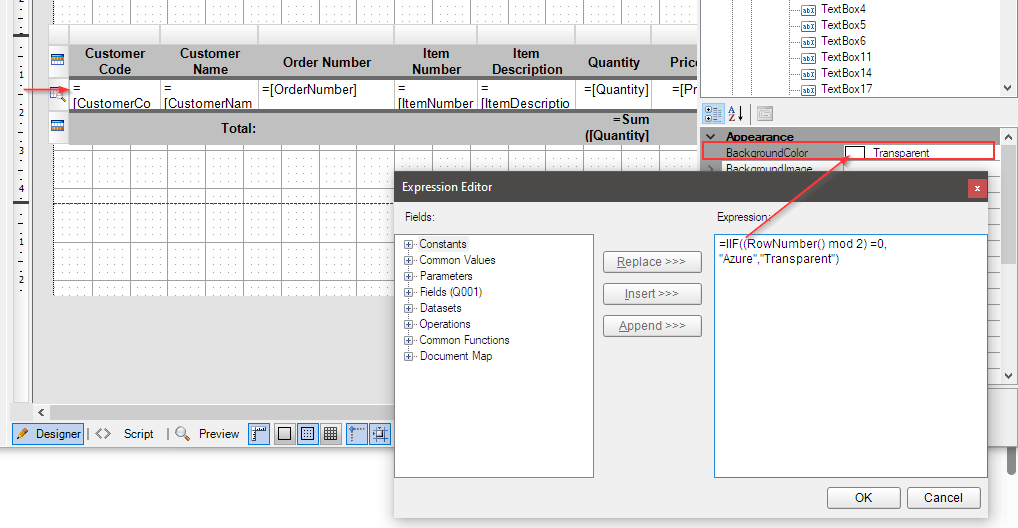
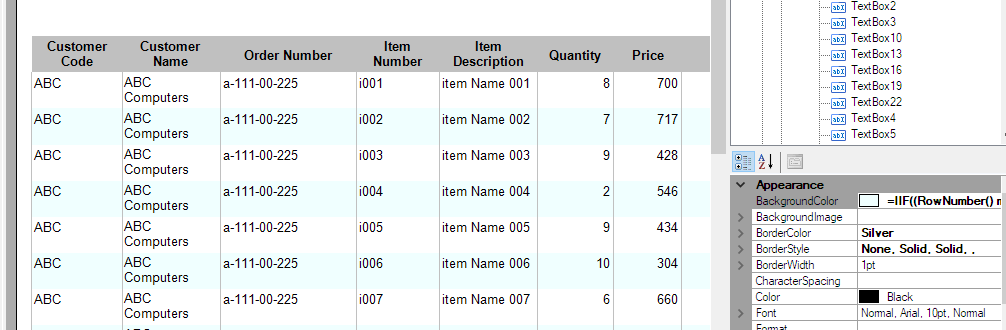
As a result, the table will look like this in the preview.
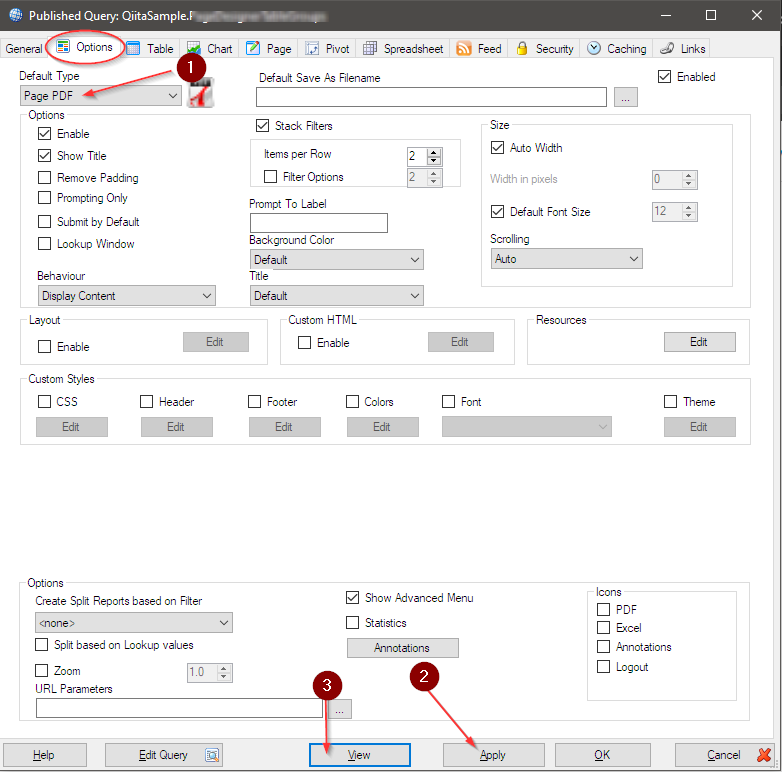
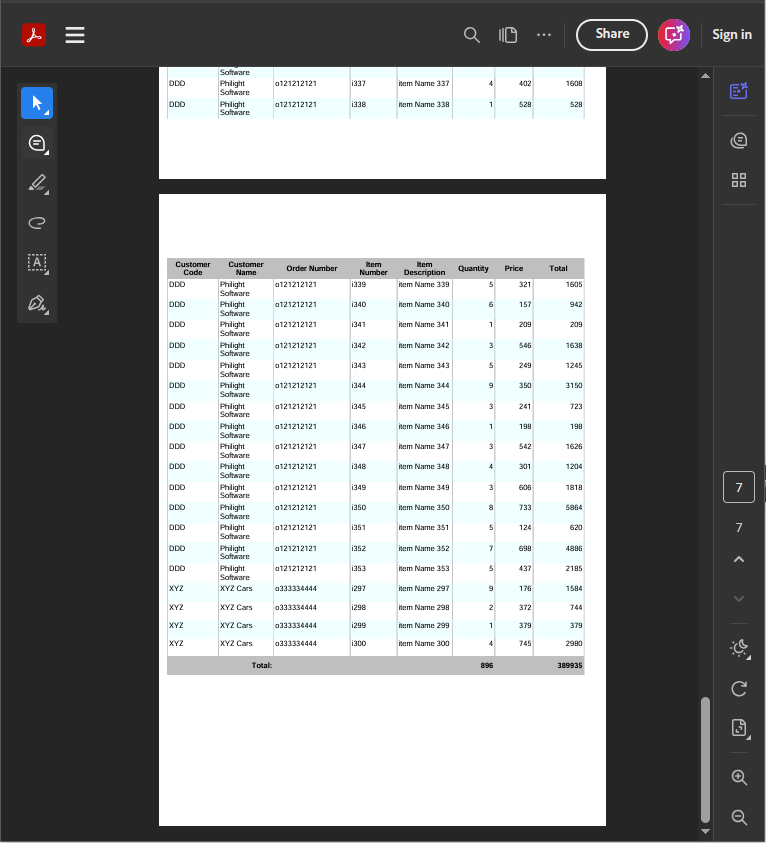
Save the design, set ‘Page PDF‘ as the default report type, and click the ‘Apply‘ button to save the published report. Then, click the ‘View‘ button to open the report in your browser (assuming the Sharperlight service is running).
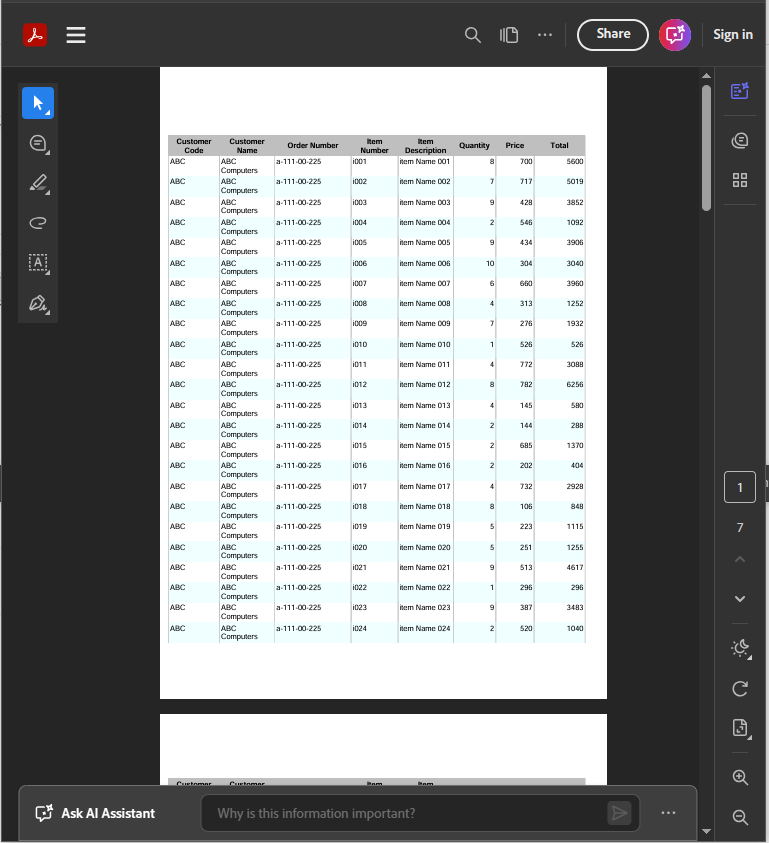
It will be displayed like this:
Afterword
Now that we’ve covered the basics of creating and styling a table, use this article as a guide to design a table that best fits your needs.
Download the published report with the page design.