
Data Entry Forms and Reports
Introduction
When developing a web application, it typically becomes a full project requiring a team of staff to be involved. It may take several months, and the development costs are far from inexpensive.
With Sharperlight installed, Foundry empowers you to develop web applications quickly and efficiently — even a single person or a small team can create a full set of input screens and reports in a short time.
In this post, we’ll walk through the steps to create a simple web application using Sharperlight Foundry.
Practices
Designing the application
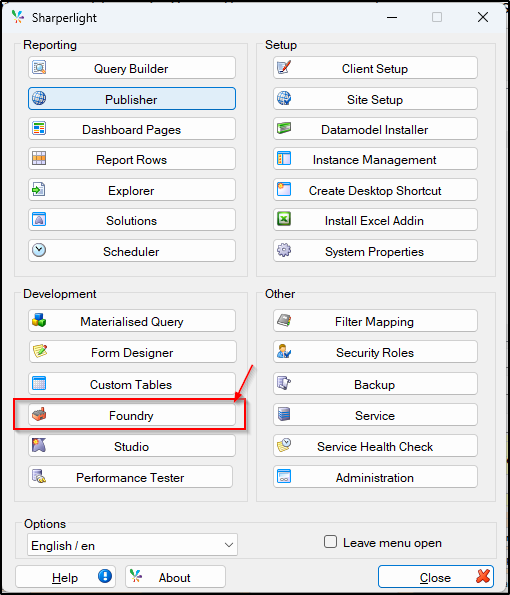
Open Foundry from Sharperlight Application menu.
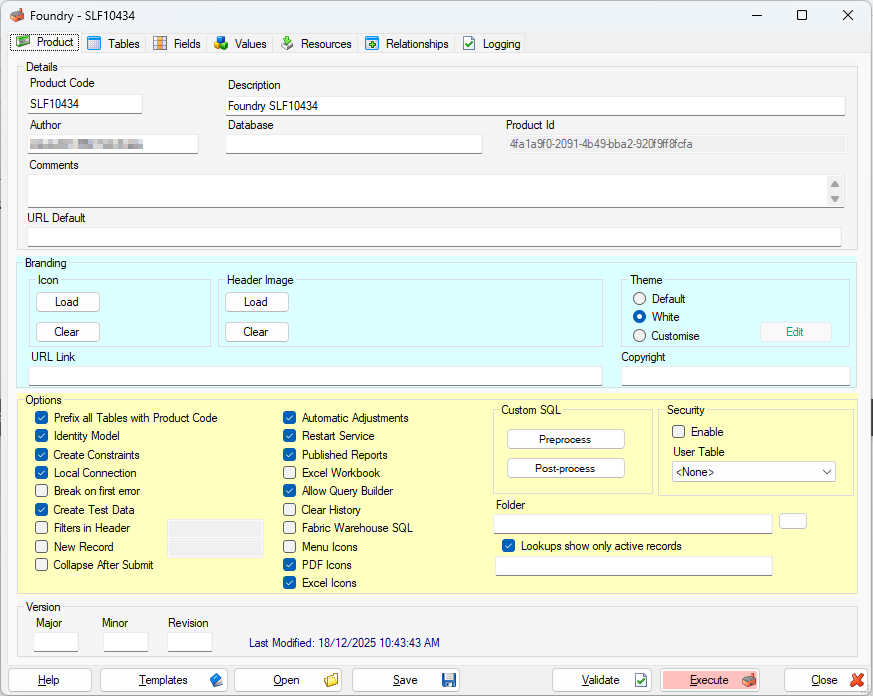
This is Foundry. Product tab is shown with the default options.
Now, let’s start creating a web application.
On the Product tab, you enter an overview of the system (product) you are about to create. Default values are pre-set for each option as shown above.
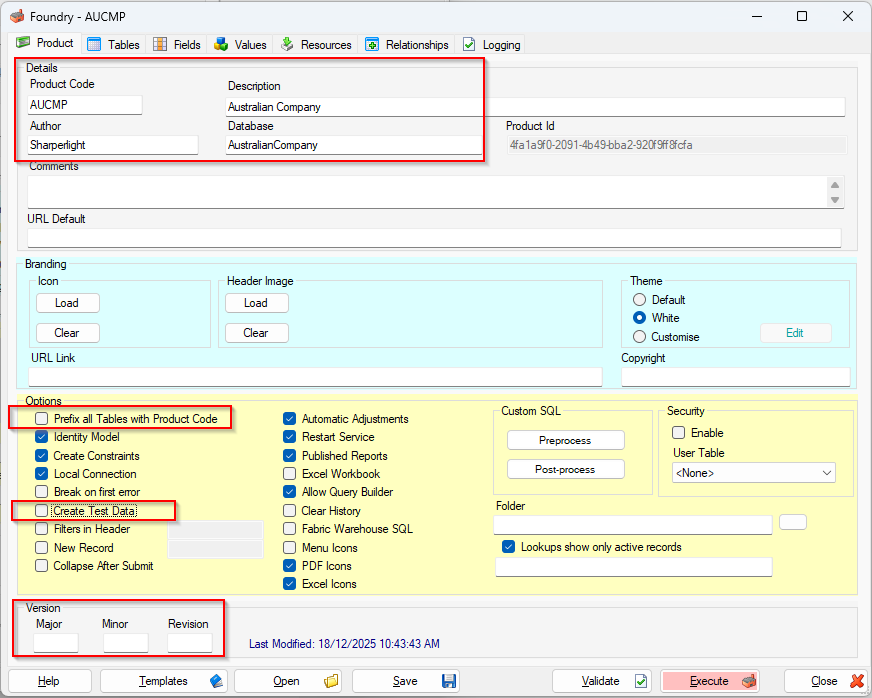
This time, we will update the following fields:
- Product Code: This becomes the code for the Sharperlight datamodel and its file name.
- Description: A brief explanation of the product.
- Author: The name of the person creating it.
- Database: Specifies the name of the database that Foundry will create.
Additionally, we will disable the following options:
- Prefix all Tables with Product Code: The table name in the database will be “AUCMP_xxxx“, when this is enabled.
- Create Test Data: To avoid Foundry automatically generating test data, please disable the “Create Test Data” option. We want to prepare our own data for this web application.
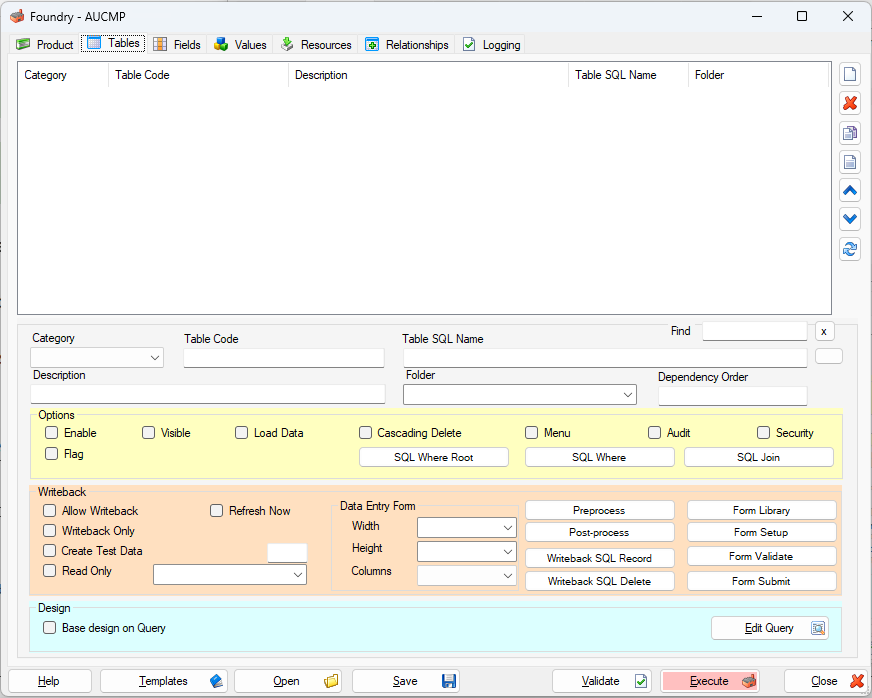
We can design the tables with the Table tab.
There are two basic types of Tables which are Dimensions and Facts.
Fact Tables contain the measured values and reference the Dimension Tables. For example “Customers” would be a Dimension and “Invoices” would be a Fact Table.
When data is loaded into the tables these categories are used to try and work out the order in which data should be loaded. The order is Dimensions then Facts as Fact Table depend on the reference data in the Dimension Tables.
The tables can be added by clicking New icon on the right-hand side and this message is shown.
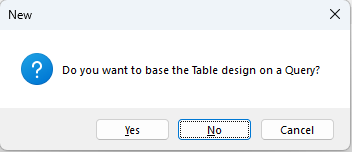
You can design a table using the Sharperlight Query Builder. The Query Builder opens when you click “Yes“.
This time, we’ll click “No” because we want to design the table manually. When you click “No”, another dialog opens where you can enter a description for the table you are creating.
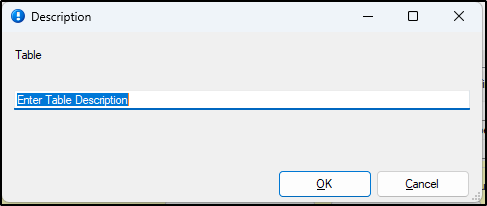
Set the description and click OK to proceed.
This is the default options.
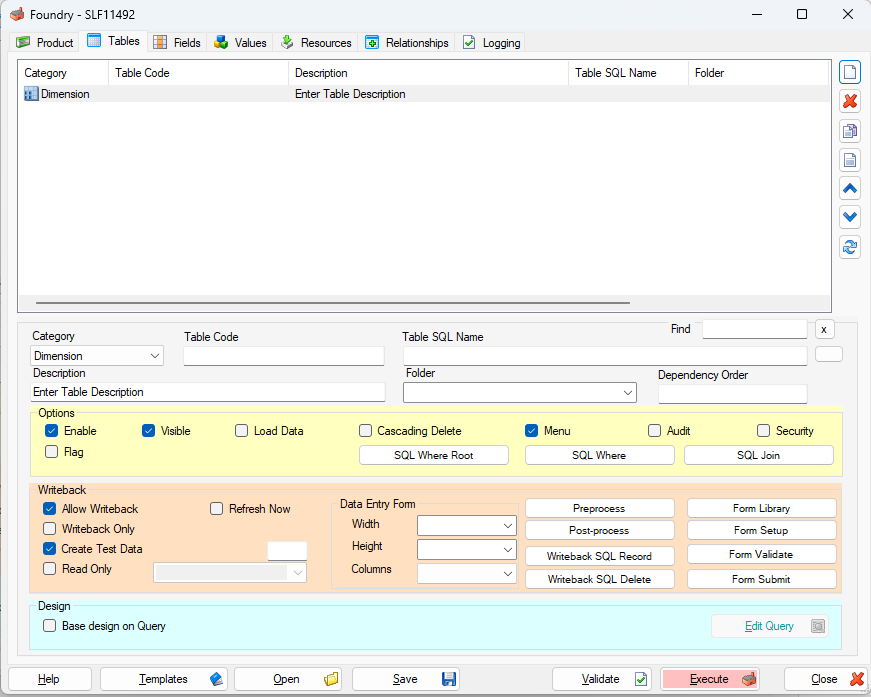
This time, we creates the following three tables:
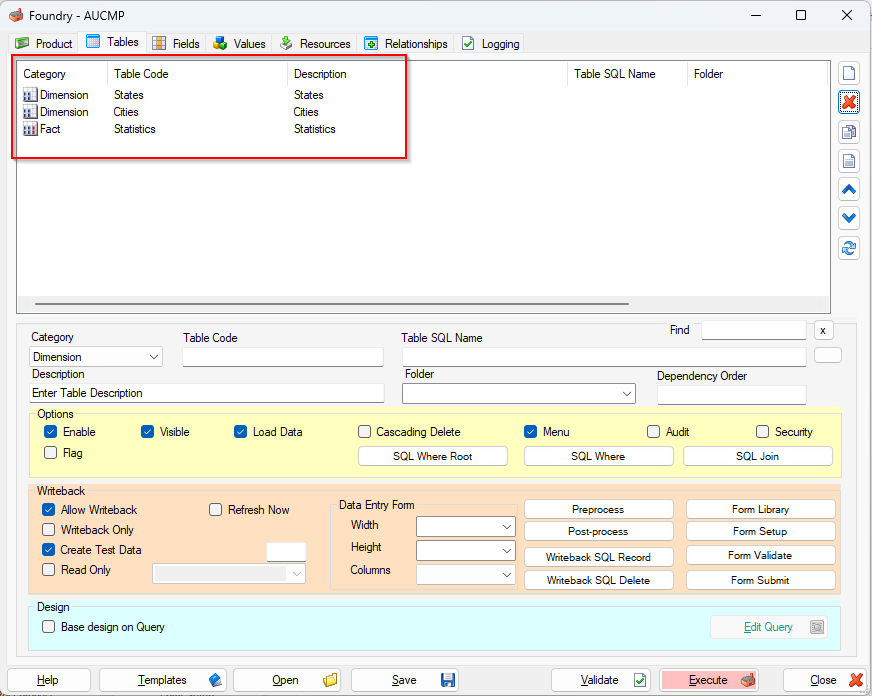
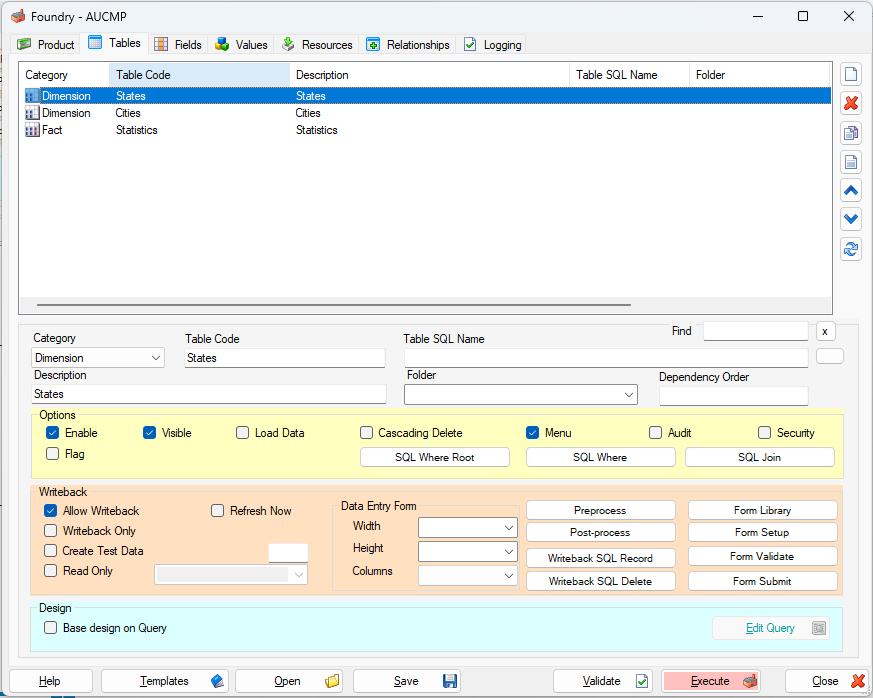
General
- Category: Dimension
- Table Code: States
- Description: States
Options
- Enable: ON
- Visible: ON
- Load Data: OFF
- Menu: ON
Writeback
- Allow Writeback: ON
- Create Test Data: OFF
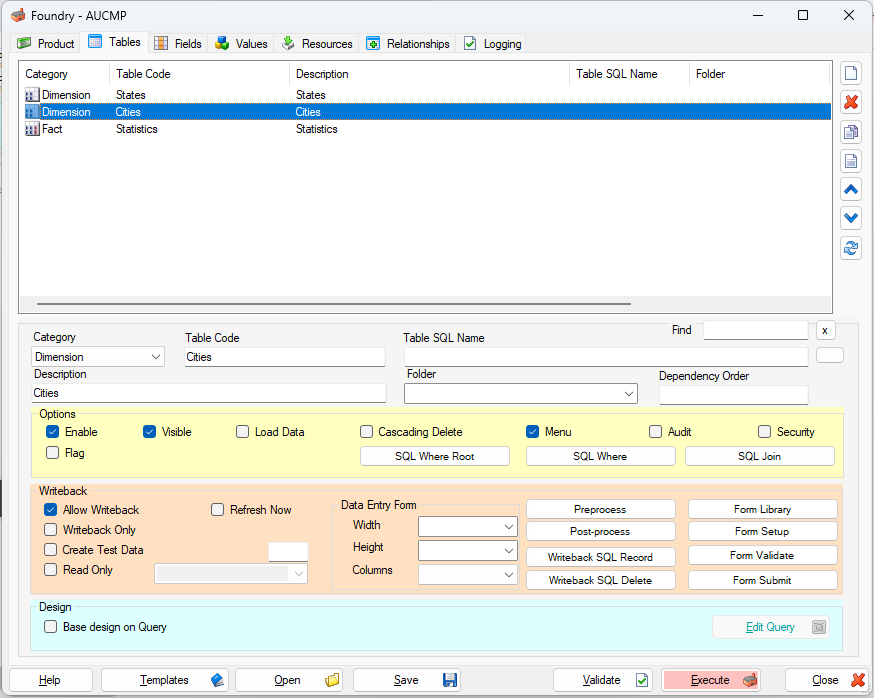
General
- Category: Dimension
- Table Code: Cities
- Description: Cities
Options
- Enable: ON
- Visible: ON
- Load Data: OFF
- Menu: ON
Writeback
- Allow Writeback: ON
- Create Test Data: OFF
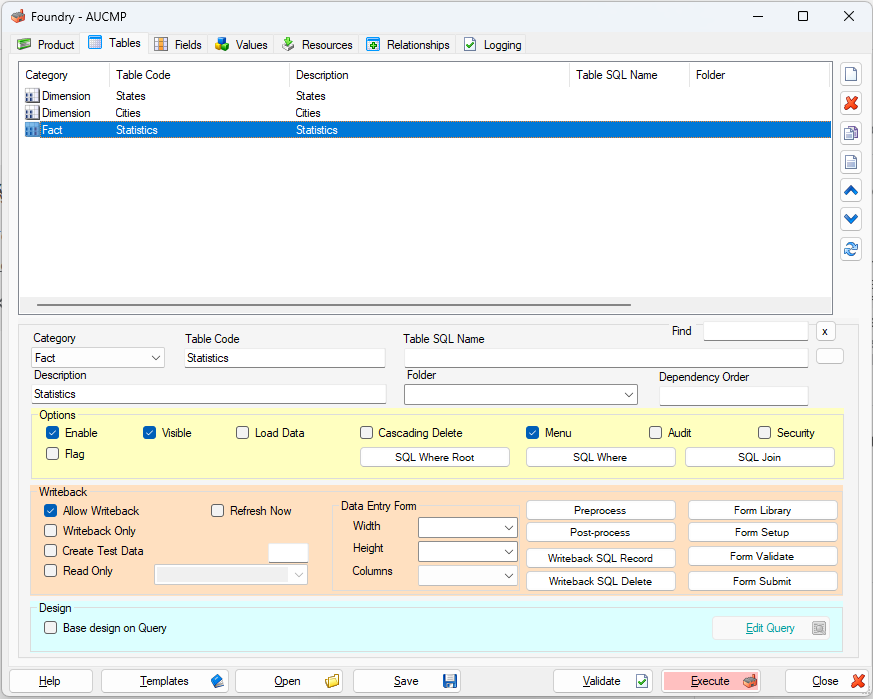
General
- Category: Fact
- Table Code: Statistics
- Description: Statistics
Options
- Enable: ON
- Visible: ON
- Load Data: OFF
- Menu: ON
Writeback
- Allow Writeback: ON
- Create Test Data: OFF
The fields for each table can be defined here.
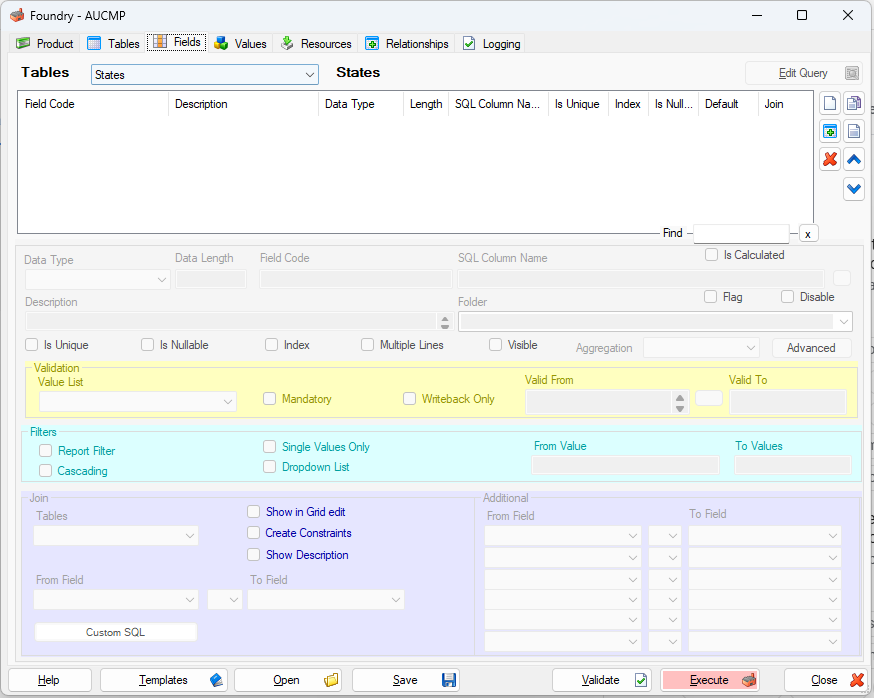
The fields can be added by clicking New icon on the right-hand side.
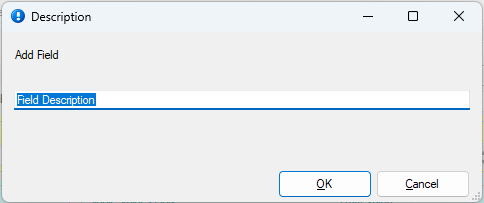
You can enter a description for the field you are creating or leave as it is and click OK to Proceed.
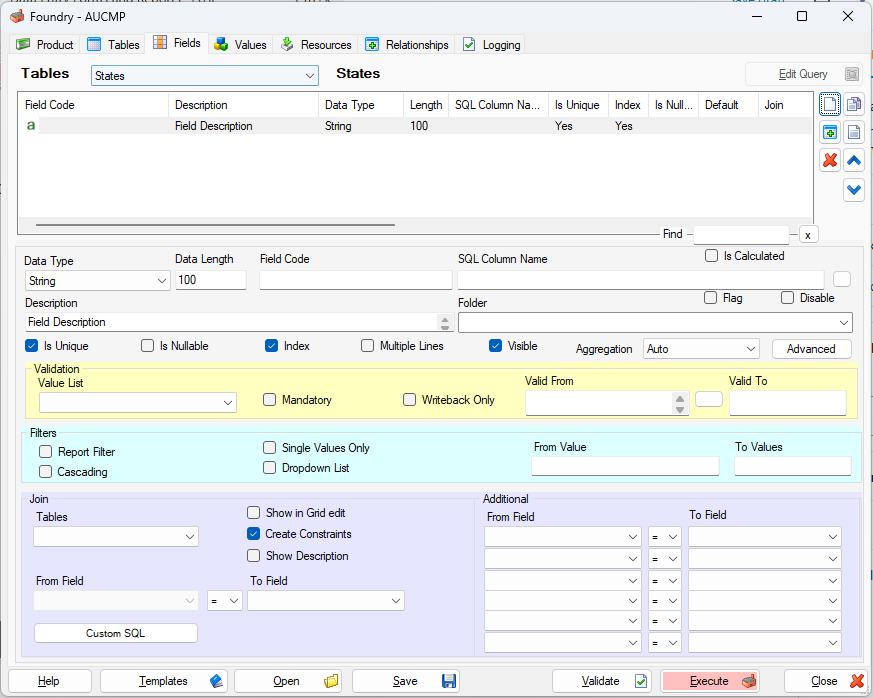
Here’s a first look at the new field design.
Let’s see the fields design for the tables.
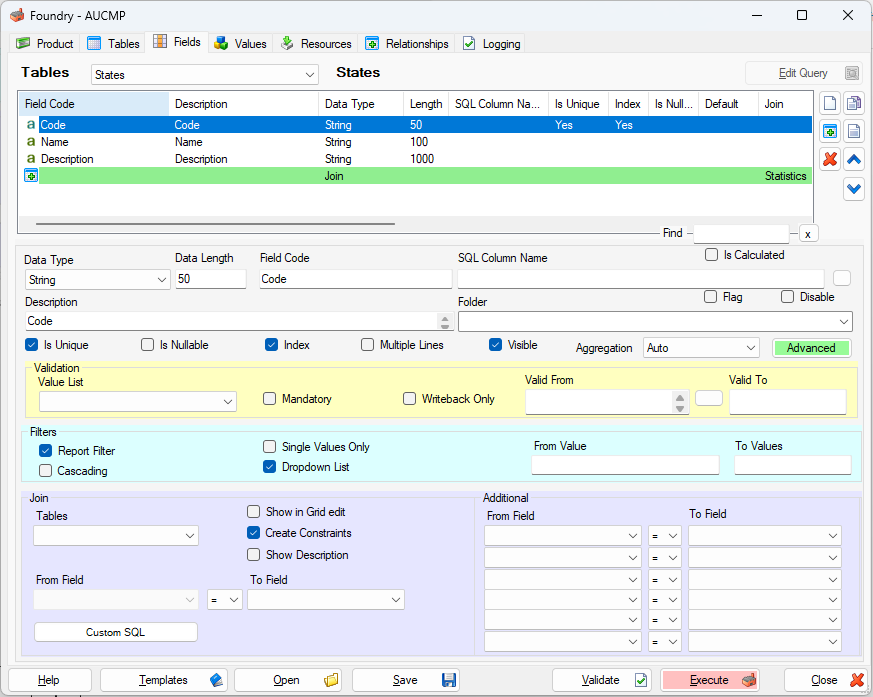
General
- Data Type: String
- Data Length: 50
- Field Code: Code
- Description: Code
- Is Unique: ON
- Index: ON
- Visible: ON
- Advanced: ON
Filters
- *Report Filter: ON
- *Dropdown List: ON
Advanced
- Allow Writeback: ON
- *Input Style: Dropdown List – Search – Show Description
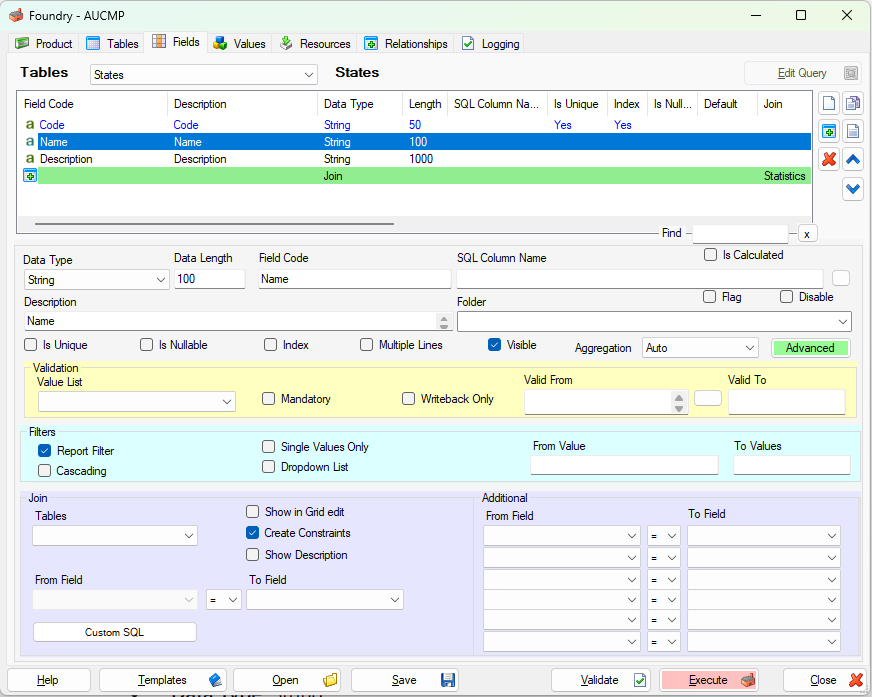
General
- Data Type: String
- Data Length: 100
- Field Code: Name
- Description: Name
- Is Unique: OFF
- Index: OFF
- Visible: ON
- Advanced: ON
Filters
- *Report Filter: ON
- *Dropdown List: OFF
Advanced
- Allow Writeback: ON
- Hide Lookup Button: ON
- *Input Style: Default
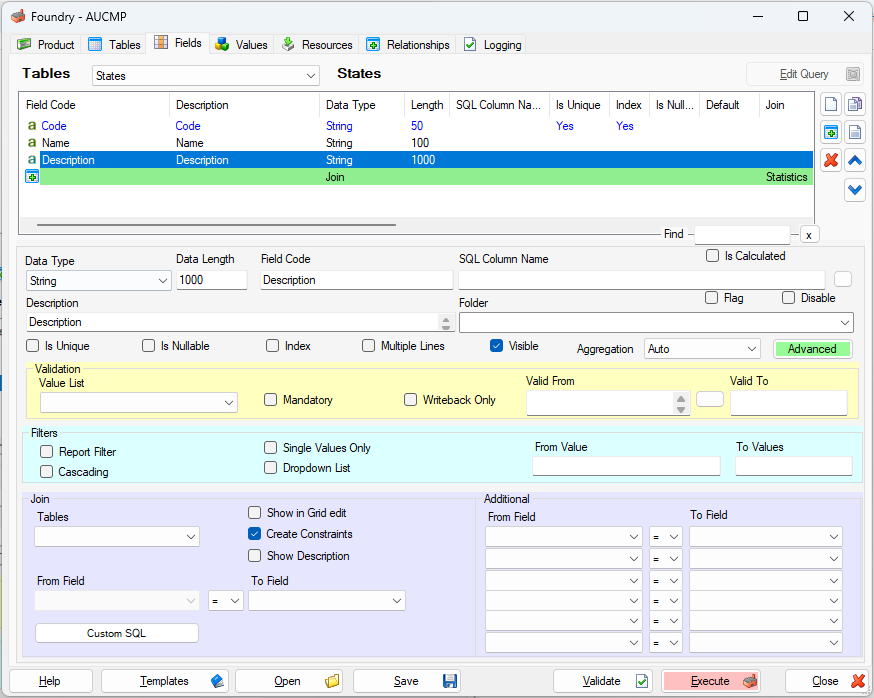
General
- Data Type: String
- Data Length: 1000
- Field Code: Description
- Description: Description
- Is Unique: OFF
- Index: OFF
- Visible: ON
- Advanced: ON
Filters
- *Report Filter: OFF
- *Dropdown List: OFF
Advanced
- Allow Writeback: ON
- *Input Style: Default
- Hide Lookup Button: ON
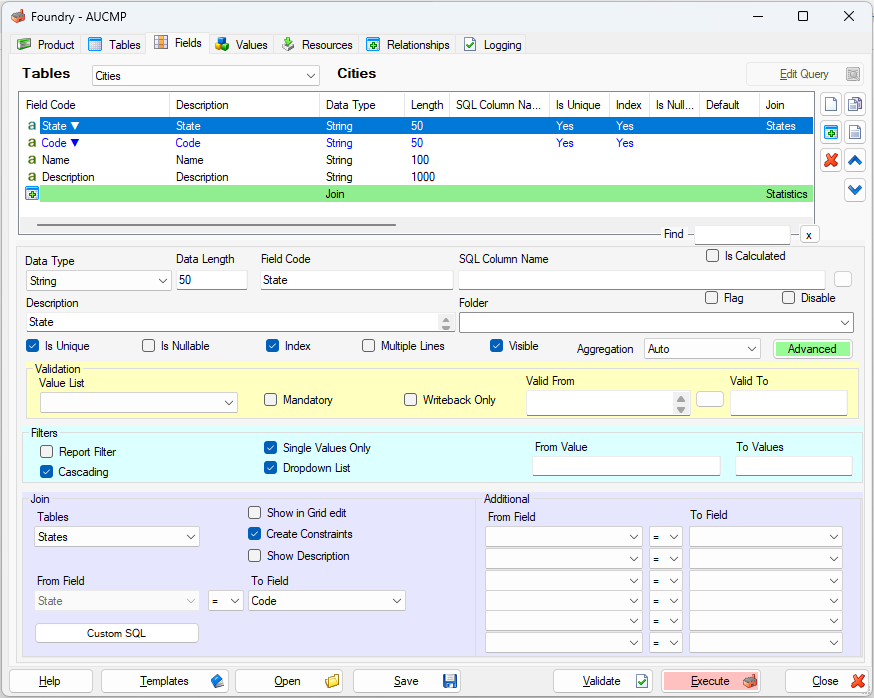
General
- Data Type: String
- Data Length: 50
- Field Code: State
- Description: State
- Is Unique: ON
- Index: ON
- Visible: ON
- Advanced: ON
Filters
- *Report Filter: OFF
- *Dropdown List: ON
- Single Values Only: ON
- *Cascading: ON
Join
- Join to the States table on the Code field
Advanced
- Allow Writeback: ON
- *Input Style: Dropdown List – Search – Show Description
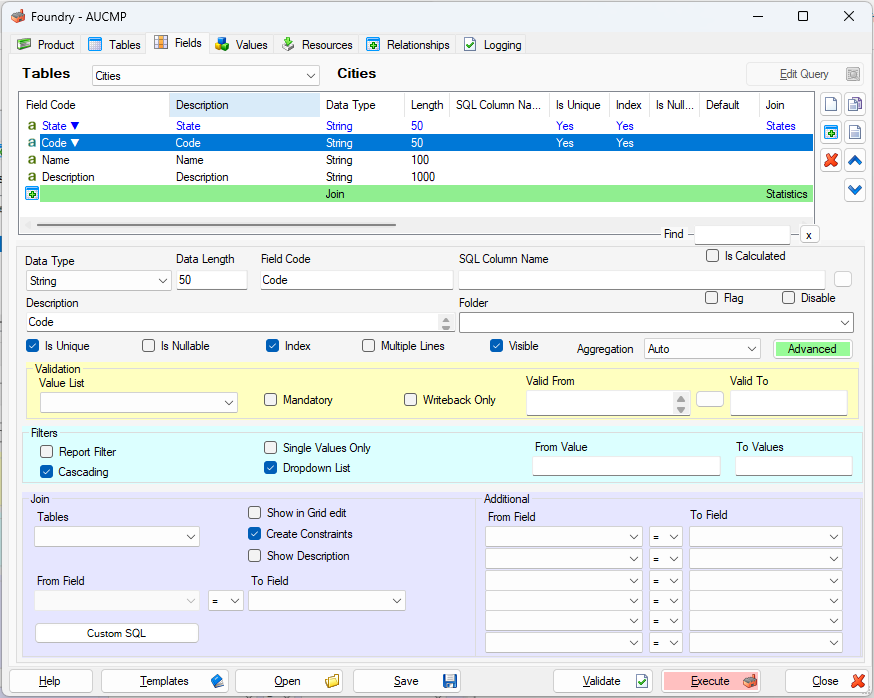
General
- Data Type: String
- Data Length: 50
- Field Code: Code
- Description: Code
- Is Unique: ON
- Index: ON
- Visible: ON
- Advanced: ON
Filters
- *Report Filter: OFF
- *Dropdown List: ON
- *Cascading: ON
Advanced
- Allow Writeback: ON
- *Input Style: Dropdown List – Search – Show Description
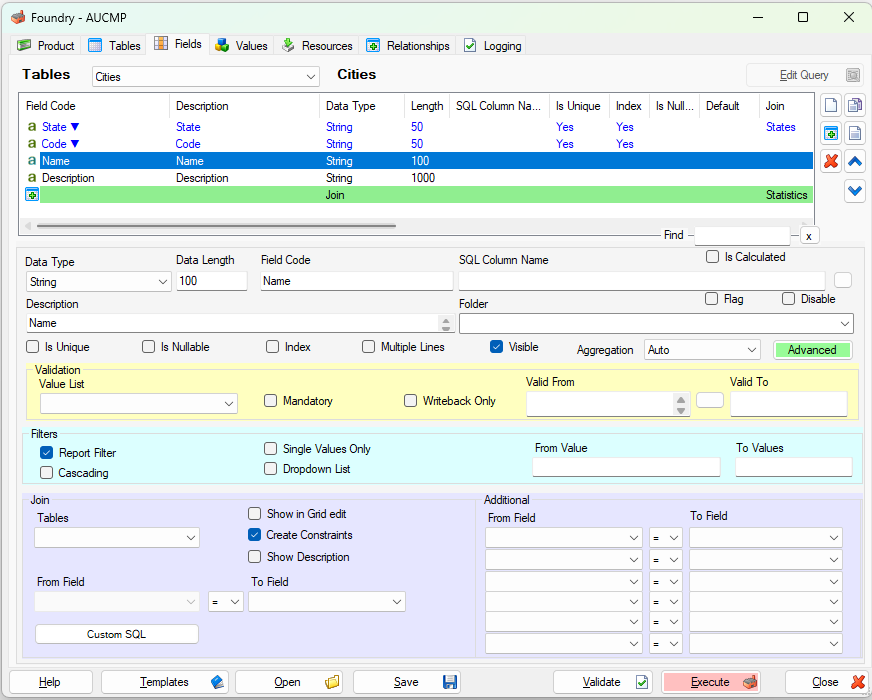
General
- Data Type: String
- Data Length: 100
- Field Code: Name
- Description: Name
- Is Unique: OFF
- Index: OFF
- Visible: ON
- Advanced: ON
Filters
- *Report Filter: ON
- *Dropdown List: OFF
Advanced
- Allow Writeback: ON
- *Input Style: Default
- Hide Lookup Button: ON
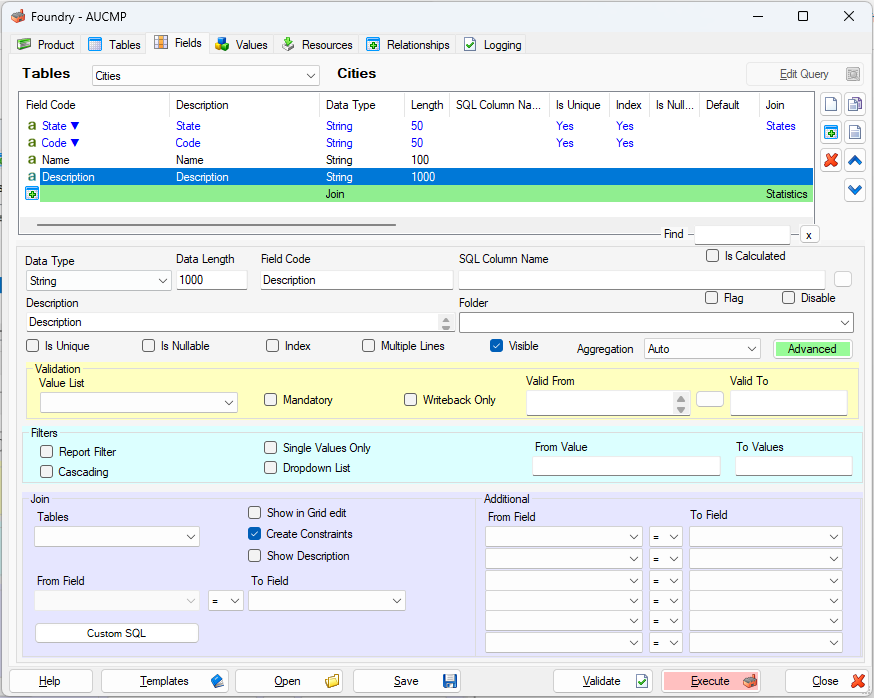
General
- Data Type: String
- Data Length: 1000
- Field Code: Description
- Description: Description
- Is Unique: OFF
- Index: OFF
- Visible: ON
- Advanced: ON
Filters
- *Report Filter: OFF
- *Dropdown List: OFF
Advanced
- Allow Writeback: ON
- *Input Style: Default
- Hide Lookup Button: ON
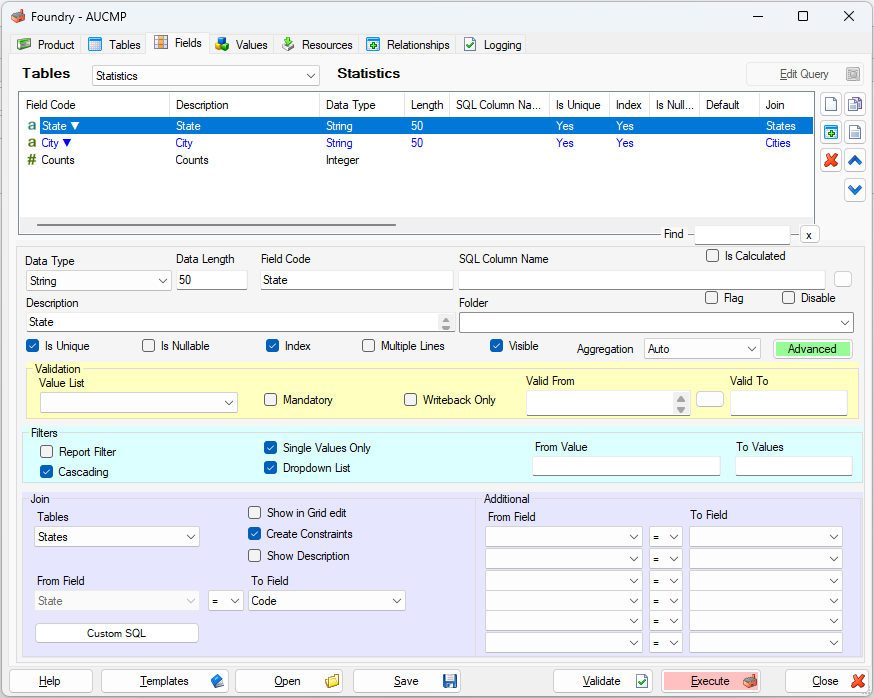
General
- Data Type: String
- Data Length: 50
- Field Code: State
- Description: State
- Is Unique: ON
- Index: ON
- Visible: ON
- Advanced: ON
Filters
- *Report Filter: OFF
- *Dropdown List: ON
- Single Value Only: ON
- *Cascading: ON
Join
- Join to States table on Code field
Advanced
- Allow Writeback: ON
- *Input Style: Dropdown List – Search – Show Description
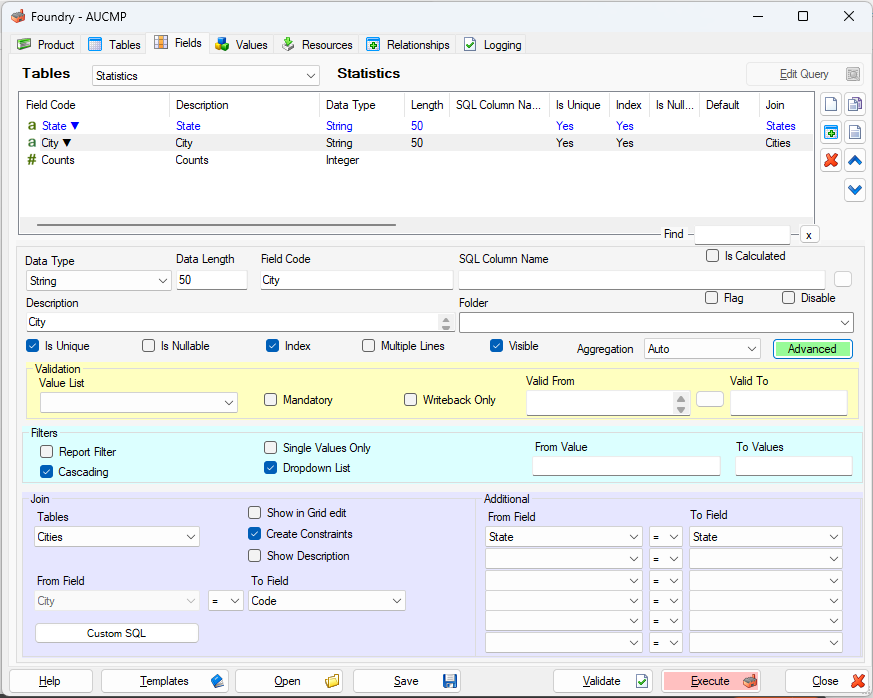
General
- Data Type: String
- Data Length: 50
- Field Code: City
- Description: City
- Is Unique: ON
- Index: ON
- Visible: ON
- Advanced: ON
Filters
- *Report Filter: OFF
- *Dropdown List: ON
- Single Value Only: OFF
- *Cascading: ON
Join
- Join to Cities table on Code field
Advanced
- Allow Writeback: ON
- *Input Style: Dropdown List – Search – Show Description
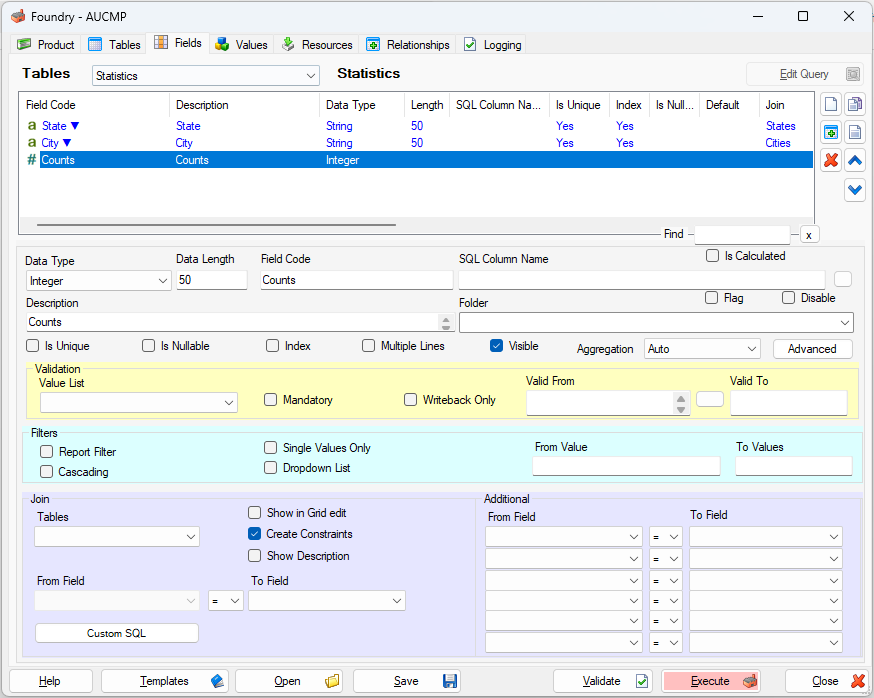
General
- Data Type: Integer
- Data Length: 50
- Field Code: Counts
- Description: Counts
- Is Unique: OFF
- Index: OFF
- Visible: ON
- Advanced: OFF
Filters
- *Report Filter: OFF
- *Dropdown List: OFF
- Single Value Only: OFF
- *Cascading: OFF
Additional Comments
*Report Filter: This field will be displayed when the table it belongs to is used in a report.
*Dropdown List: The Dropdown List control is used when this field serves as a filter in a web report.
*Cascading: This field acts with other filters to narrow the selection options in the dropdown list based on the value selected in the previous filter.
*Input Style:
Joins:
The Join in the both table “States“ and “Cities“ are added when this Foundry is executed.
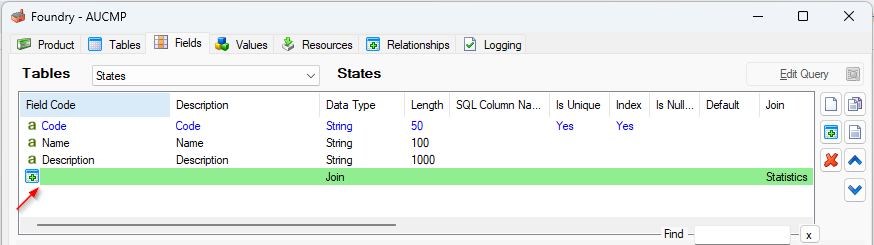
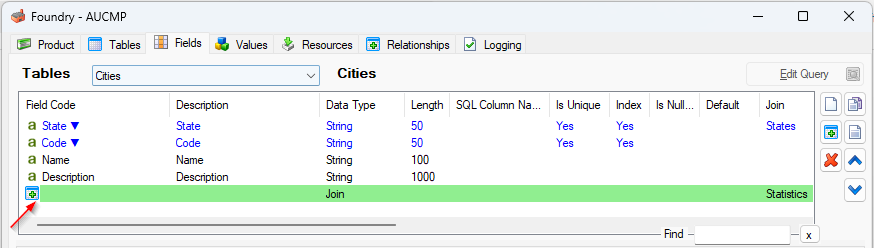
It is because the Fact table “Statistics” has joins to the both table.
Preparing its data
Sometimes you need initial data loaded when the application is deployed. Foundry supports this by building the feature into the datamodel it generates.
Preparing SQL Scripts
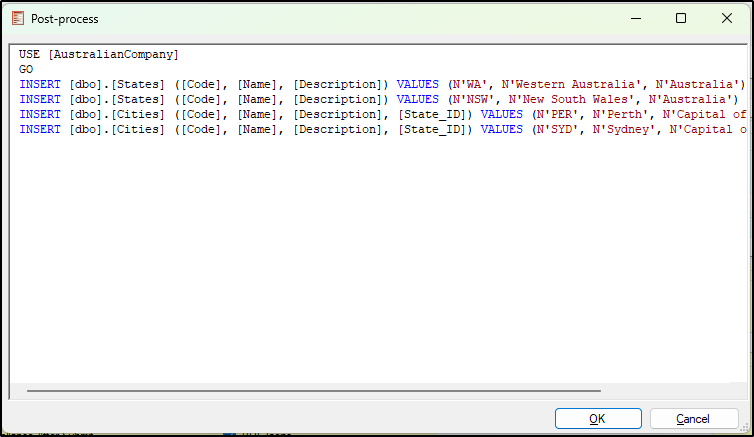
We prepared this SQL Scripts here.
USE [AustralianCompany]
GO
INSERT [dbo].[States] ([Code], [Name], [Description]) VALUES (N'WA', N'Western Australia', N'Australia')
INSERT [dbo].[States] ([Code], [Name], [Description]) VALUES (N'NSW', N'New South Wales', N'Australia')
INSERT [dbo].[Cities] ([Code], [Name], [Description], [State_ID]) VALUES (N'PER', N'Perth', N'Capital of Western Australia', 1)
INSERT [dbo].[Cities] ([Code], [Name], [Description], [State_ID]) VALUES (N'SYD', N'Sydney', N'Capital of New South Wales', 2)
Foundry Post-Process
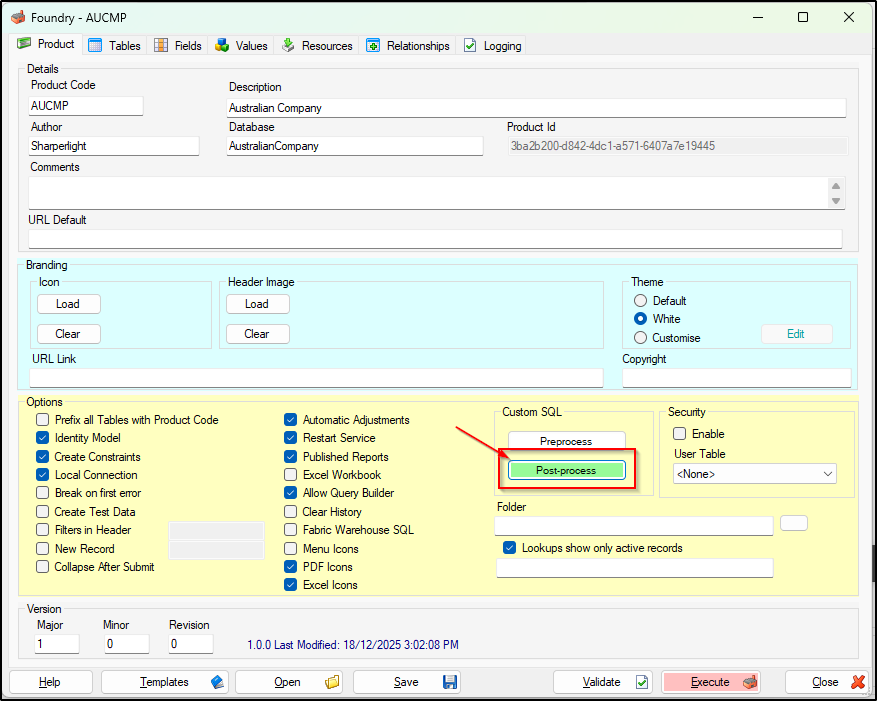
We place the SQL scripts into Post-Process option in the Foundry definition.
Save and Execute
The Application Design Is Now Complete.
Save the design by clicking Save button.

Then click Execute to generate the database, the datamodel, a set of reports in Publisher and insert the predefined dataset.

While Foundry generates the objects, it logs its actions, and you can view the log.
You will be notified if any errors are detected.
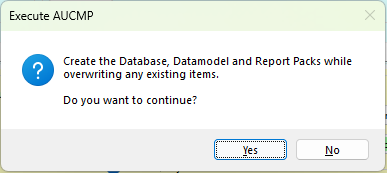
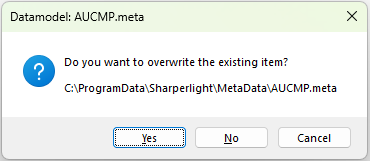
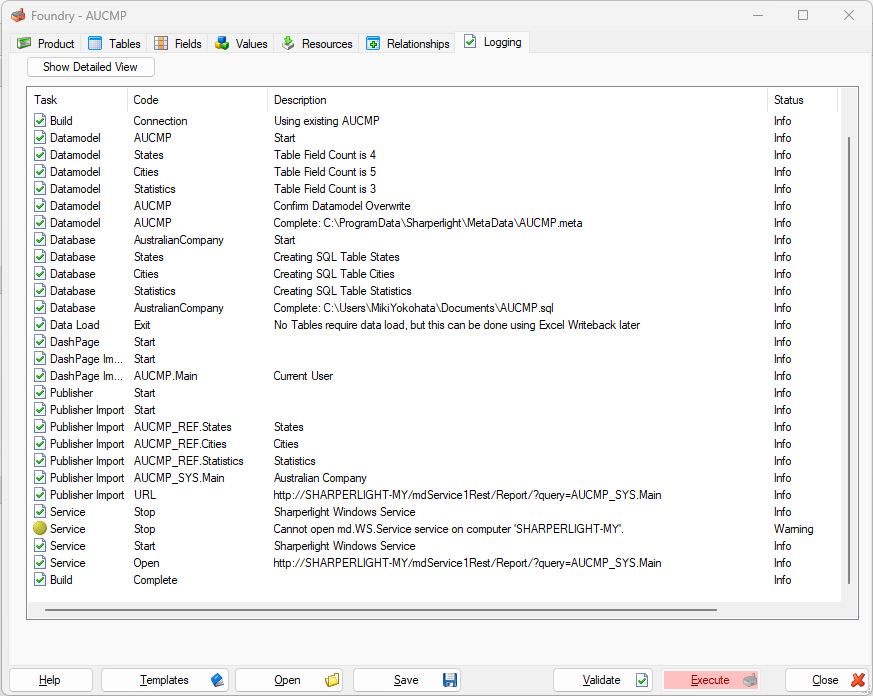
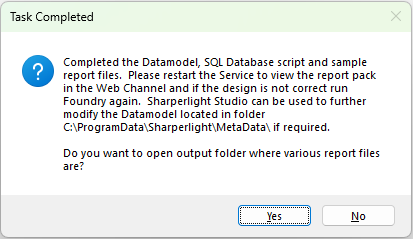
The final message dialog opens as soon as the process is completed.
Click No for close, and click Yes if you want to see the generated files.
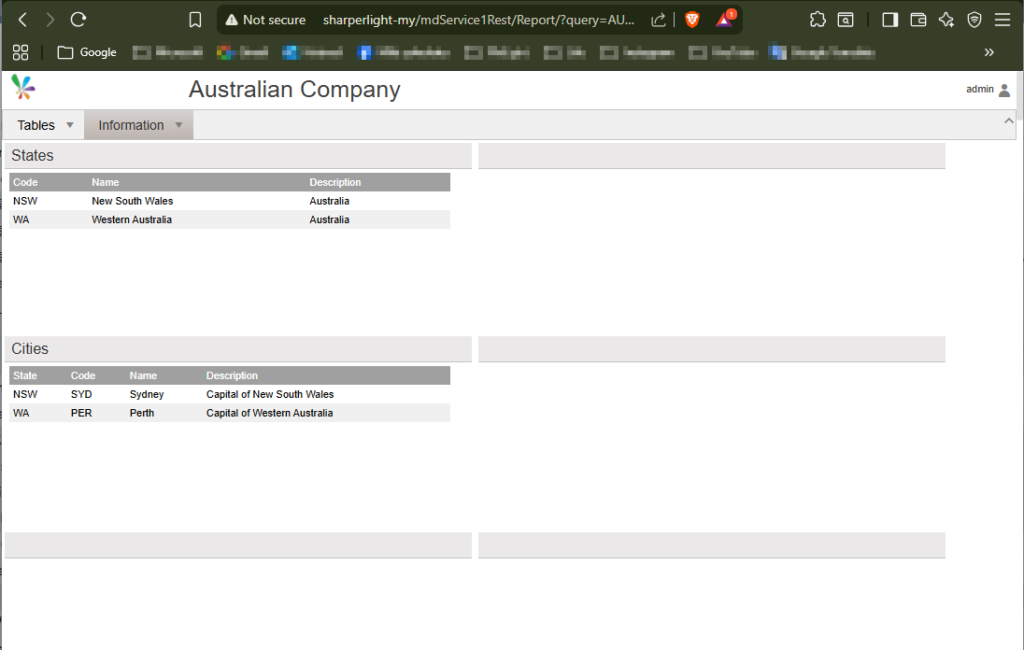
At the same time as the final message is displayed, the generated dashboard page for the new application is displayed.
The dashboard page should display correctly if you run Foundry as Administrator. This is because the Sharperlight service restarts properly during the generation process when launched with administrator privileges.
If you run Foundry as normal user, please restart the Sharperlight service manually and refresh the dashboard page if required.
The generated dataset is displayed as you can see here.
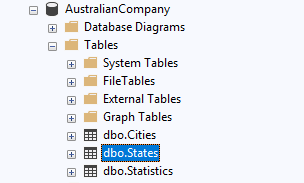
Verification
The database is created in the database server where Sharperlight system database is in.
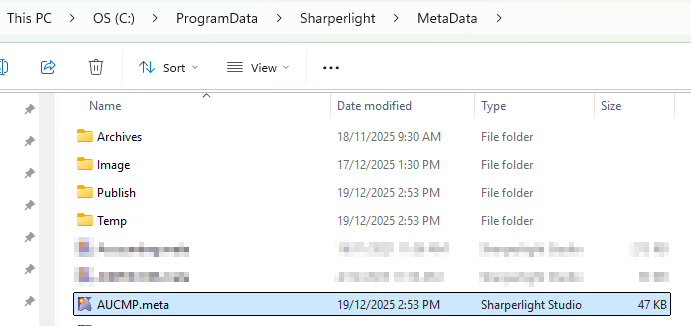
The Datamodel is also created here.
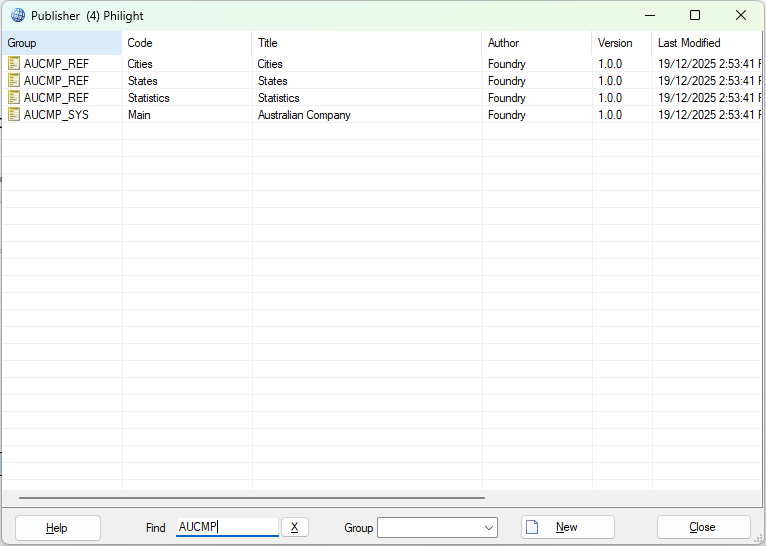
A set of reports is also in Publisher.
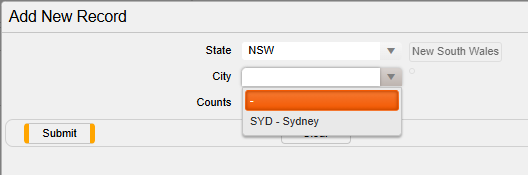
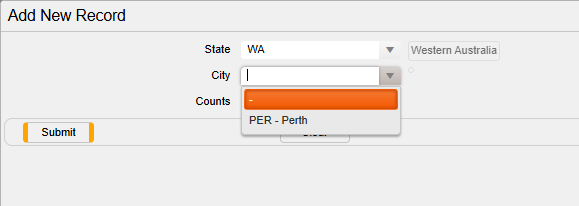
Do you remember we set “Cascading” Option for “States” field and “Cities” field in the Statistics table design.
It makes that the Cities dropdown list holds the list of cities which belong to the State chosen with the States Dropdown list.
Afterword
In this post, we’ve shown how to create a web application using Foundry. We hope you found it easy to configure the various settings through Foundry’s user interface.
Most of these settings — with the exception of database creation — can also be configured when manually creating a datamodel.
In a future post, we’ll explain the relationships between these options and how specific Foundry settings map to datamodel attributes.