
Expression: Displaying icons in a web report
Introduction
This post shows you how to display icons in a web report using an expression.
Practices
Query Definition
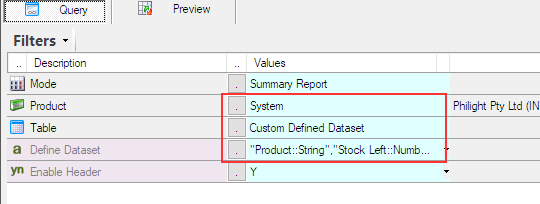
Let’s create a web report using Sharperlight Publisher and design a query like this. Since this is a simple dataset, I use the ‘Custom Defined Dataset’ option to prepare it.
The custom defined dataset is a comma separated list like this.
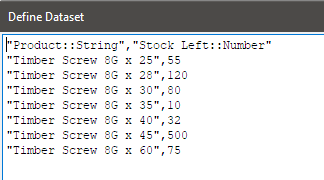
This is the output definition of the query.

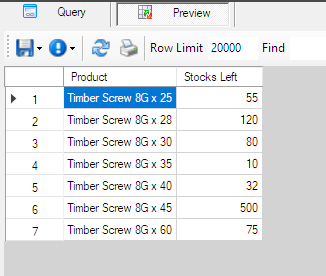
The query result, as shown with the preview option, looks like this.
Creating expression to display icon
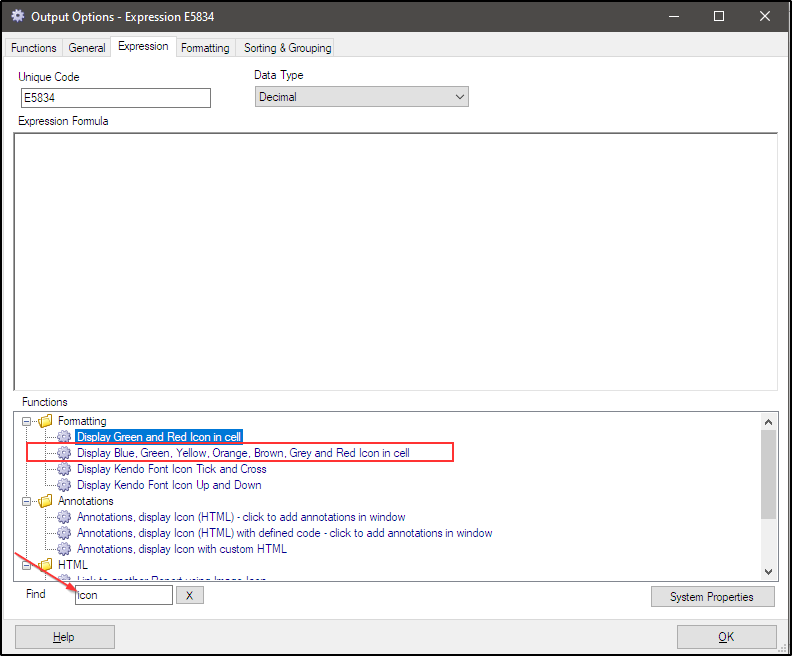
Use Find option for searching the functions for displaying an icon.
Type ‘icon’ in the Find textbox, choose ‘Display Blue, Green, Yellow, Orange, Brown, Grey and Red icon in cell’ under Formatting node.
The template for the formatting function is displayed.
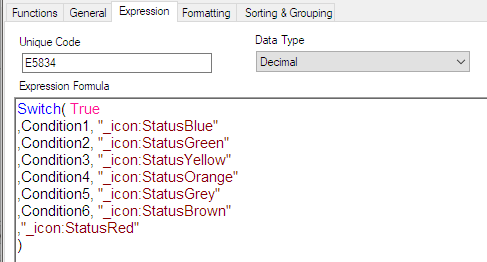
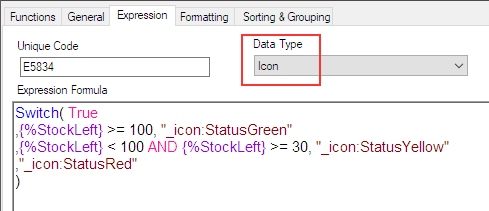
Edit the template.
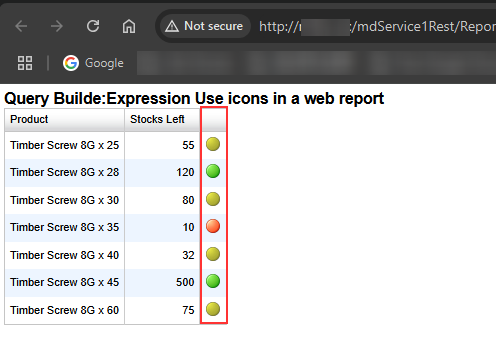
The scenario is that a green icon is displayed when the Stocks Left is 100 or greater, a yellow icon is displayed when it is between 30 (inclusive) and 100, and a red icon is displayed otherwise.
Don’t forget to set the Icon for the Data Type property.
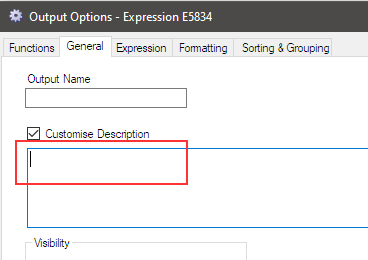
This column shows icon only so I remove its description.
Preview the query.
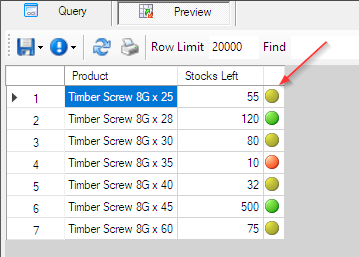
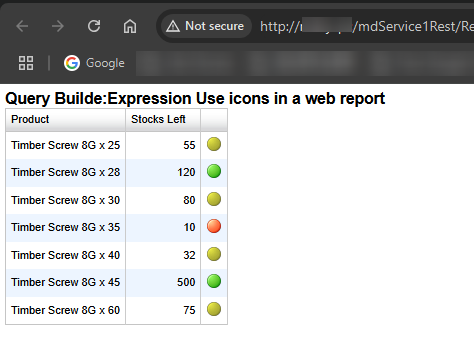
This is also the query definition for the web report. View the result in a web browser.
Afterword
I believe icons are a great way to grab the viewer’s attention. Try using them in your business.