
Getting Report values to go across Columns instead of down the Rows
Dynamic Columns allow the creation of Reports with values going across the Columns instead of down the Report in the Rows. Dynamic Column Reports can use the Lookup values of any Field, for example a Period, Month, Region, Status Code or Description to generate the Dynamic Columns. Dynamic Column are derived from the unique values of the Field’s Filter Lookup and then are bound to one or more Output Fields. The Output Field will usually have some sort of aggregation applied to them as Sum or Count and once the Filter is bound to it the Filter’s criteria will only be applied to that Output and not to the rest of the Report.
The basic steps for creating a Dynamic Column Report are as follows
- Create the basis of the Report using Summary Report Mode
- Decide what Field will drive the Dynamic Column and add it to the Filters List
- Give the Field in the Filter List a Name by right clicking on it and selecting Change Name
- Output a number of Fields some with Aggregations like Sum()
- To bind the Dynamic Column Filter to the Output Fields select the target Output, right click and select Options
- On the Output Field Functions Tab, Select and Tick the Filter name and Set as Dynamic Output in the Apply Filters to this OutputFrame
- Preview the Data, there should be Columns for every value of the Filter that has been set as the Dynamic Column
Notes:
-
- Make sure that you do not have the same Field as a Dynamic Column Filter and also an Output.
- The upper limit for the unique values that make up the Dynamic Columns is 999 items
- If a Dynamic Column is based on a Period, Date, Year, Month or Time then Columns will be generated for the values within the Field’s Filter range. If the Field is set to so that its everything up to today’s date for example then a start point will be set that tries to stay within the 999 items limit.
- You may bind the Dynamic Column Field to more than one Output for example you may want to bind a Period Filter to Actual, Budget and Variance outputs.
- It is possible to create row Totals for values in the Dynamic Column range by create an Expression that references the Outputs in the Dynamic Column range. Do not bind the Dynamic Column to the Total Expression in this case.
- To better control the Values that are generated by a Dynamic Column it is possible to base the Dynamic Column on a Filter Sub Query. The Sub Query can exclude and include values using any number of Filters and return the lists of values that will drive the Dynamic Columns
- A Dynamic Column is created when you bind a Filter to an Output Field. Once this is done the Filters criteria is only applied that Output and is not applied to any other area of the Report.
- Excel Tables do not handle dynamic variations in the number of Table columns so if you are using this functionality in Excel ensure that the same number of columns are generated during each recalculation
- If a Filter is bound to an Output but is not set as dynamic it becomes a Filtered Column. This means the Field criteria is only applied to that Output and nowhere else in the Report. The Output caption behaves like it normally would. Filtered Columns are useful when each column or the Report has different filter criteria
Example
For this example we will create a Dynamic Column report for Sales by Period with Regions on the Columns using the Adventure Works Demo and publish it through the Web Channel

Create the Basis of the Report using Query Builder
Filters
Filtered on Order Date and Set Options to get just the Year() on the Functions Tab, Changed Name to SalesYear and and Description to Sales Year
CreaCreate a Region Filter which will be the Dynamic Column Driver by selecting Sales Territory Name in Selection Tree and dragging it into the Filter List. Once in the list it’s Description was changed to Region and its Name to RegionFilter
Outputs
Output the Order Date and changed its Description to Year and it Function to just get the Year() part of the Date
Output Order Date again and changed it Description to Quarter and it Function to get just the Quarter() part of the Date
The Sum() of the Total Due is the Output that will be bound to the RegionFilter. The binding steps will follow in the next Step
Bind the Total Due Output Field
Bind the Total Due Output Field to the RegionFilter to turn it into a Dynamic Column by selecting right clicking on Total Due and selection Options. Select the Tick box for RegionFilter in the Apply Filters to this Output frame and click the Set as Dynamic Output button

Specify the Sort Order and Create Sub Totals on Year (Optional)

Preview Dynamic Columns Report

Customize the format of the Dynamic Column Captions (Options)
Especially when dates are used as Dynamic Columns you may want to format the Values to show Month as Jan, Feb and Mar etc. instead of Months as numbers.
Before Customizing the Captions

Customizing the Captions
Select the Output Options and tick the Customize Caption on the General Tab
Use the Lookup button to bring up the Customize Caption Lookup that has various templates for being Expressions that can reformat the values.
Open the Folder Dynamic Output Value Lables folder in the Select List
Select on of the Templates and Edit the Expression to suit. They are very simple to any Output Expression where {Value} is the Dynamic Caption.
After Customizing the Captions you can see the Month names

Video
Running Totals
In this example a Running Total is shown that takes the previous Dynamic Column Value and adds it’s value to that.
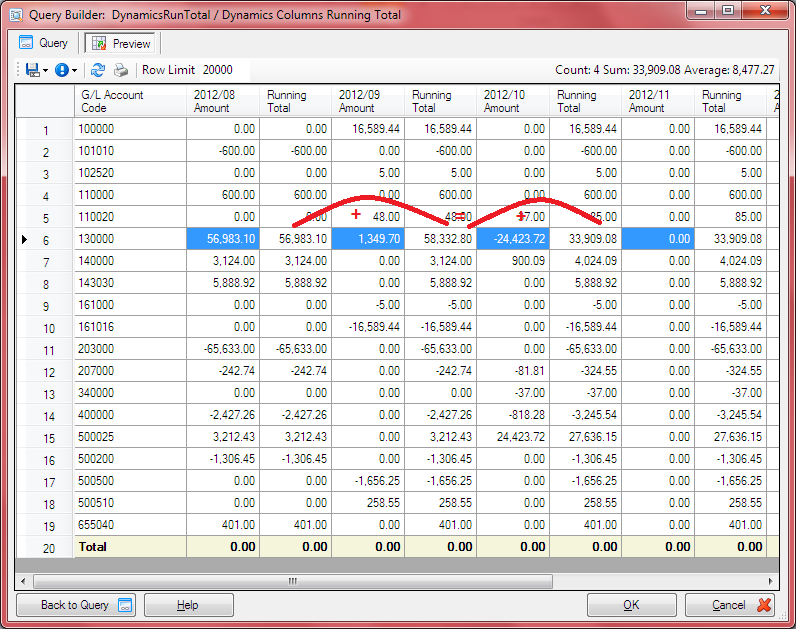
Query Builder showing two Dynamics Columns bound to the Period where the first Column is the Amount and the second is a Expression that adds the current Amount to the Previous Running Total Expression
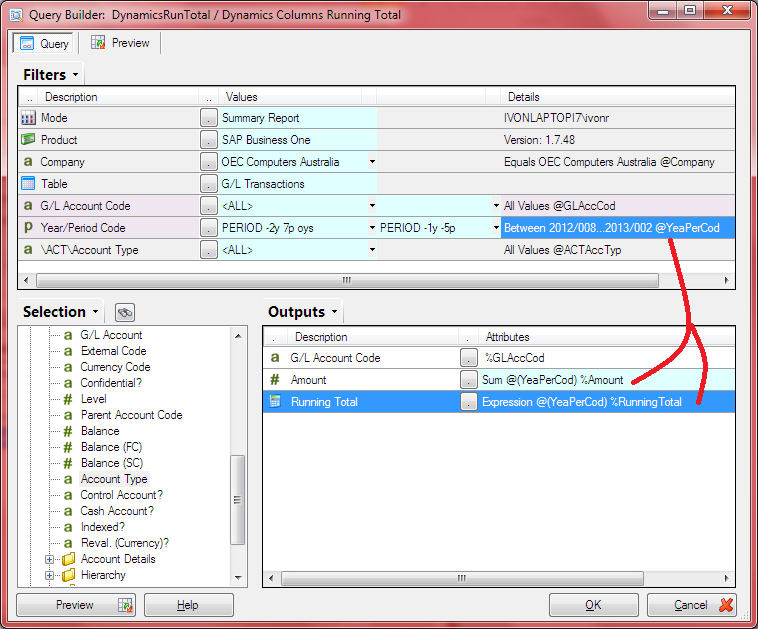
The Running Total Expression
IIF( dataResults.column.items( outputCurrentIndex ).GetDynamicIndex()=0
, {%Amount} , CurrentRow.cell( outputCurrentIndex-2) .value+{%Amount}
)
outputCurrentIndex
The current output index position where 0 would be the first column.
dataResults.column.Items( n ).GetDynamicIndex()
The Dynamic Column Index where 0 would be the very first Dynamic Column
CurrentRow.cell( n ).value
The values of the outputs for the current row where 0 would be the first column Note: that you can not reference another Expression with a higher index position as it’s value would not be calculated at that stage.
